
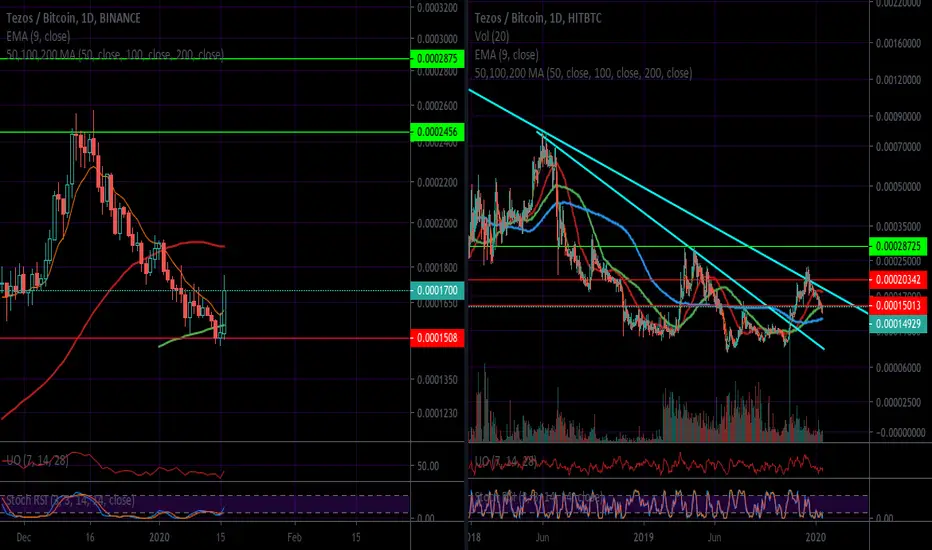
Pretty simple. This is my first XTZ chart. I don't own any, but I was explaining to my small group recently that the 1500 level must hold for XTZ to make another move up. This is exactly what has happened. Unfortunately I was busy for much of today, so I wasn't able to post this before the recent price move. On the right, you can see the HitBTC chart with more historical data. There, it becomes clear how important the 1500 level is. XTZ also has a bear market downtrend to contend with in the 1800 area, but once that clears, it can test the recent high, or even the 2800-2900 area.
In sum:
BUY - 1500-1700 or now with a stop loss below 1470
SELL - 2400 - 2900; short term 1880 (near 50d MA)
If 2900 breaks, XTZ can go on a much larger bull run. Will have to reassess if and when it gets there.
That's it!
This is not financial advice. This is meant for speculation and education only.
-Victor Cobra
In sum:
BUY - 1500-1700 or now with a stop loss below 1470
SELL - 2400 - 2900; short term 1880 (near 50d MA)
If 2900 breaks, XTZ can go on a much larger bull run. Will have to reassess if and when it gets there.
That's it!
This is not financial advice. This is meant for speculation and education only.
-Victor Cobra
노트
Perhaps a decent entry point coming up here, maybe even a retest of the 100d MA (green), in the mid-1500 area. If one has been looking for a position on Tezos, now I think is a good time to scout for a potential entry. 노트
We are now at the 10d MA, so this might be the extent of the initial correction. We'll see.노트
XTZ made it to my first potential target and got rejected at the 50d MA. Probably best to wait and see until that breaks. It looks like my short term buy and initial sell zone was pretty accurate though. 노트
Moving up towards the second target level. 노트
After blasting through all my targets and the downtrend, XTZ may be headed towards higher historical levels. The 0.00052-55 area is the next major resistance zone. 
관련 발행물
면책사항
해당 정보와 게시물은 금융, 투자, 트레이딩 또는 기타 유형의 조언이나 권장 사항으로 간주되지 않으며, 트레이딩뷰에서 제공하거나 보증하는 것이 아닙니다. 자세한 내용은 이용 약관을 참조하세요.
관련 발행물
면책사항
해당 정보와 게시물은 금융, 투자, 트레이딩 또는 기타 유형의 조언이나 권장 사항으로 간주되지 않으며, 트레이딩뷰에서 제공하거나 보증하는 것이 아닙니다. 자세한 내용은 이용 약관을 참조하세요.