
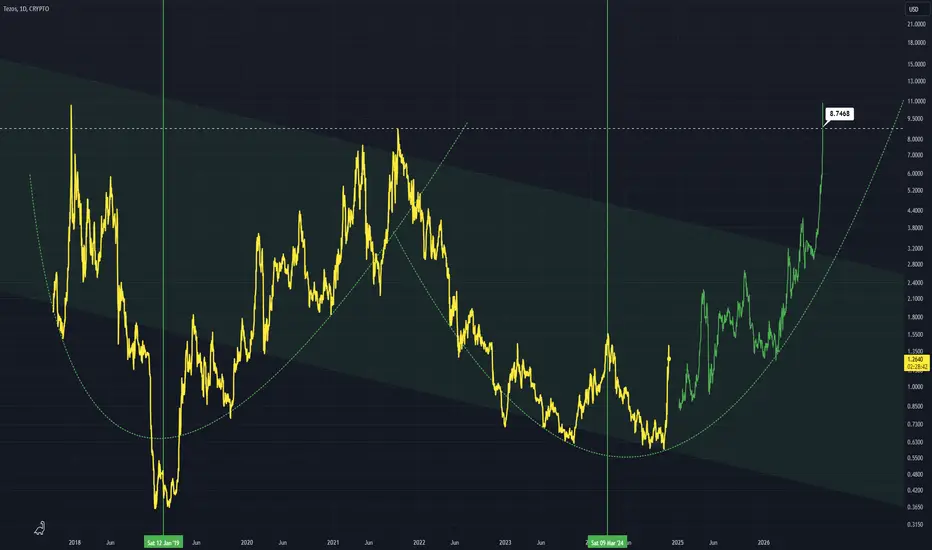
Although a large down channel can be plotted an overarching W pattern can be observed with highs at the dashed white line
Right now XTZ is moving from a bear market into a bull one
I see a pump up to about ~$8
The vertical lines show the point where the shift from bear to bull occurs
Daily chart
Right now XTZ is moving from a bear market into a bull one
I see a pump up to about ~$8
The vertical lines show the point where the shift from bear to bull occurs
Daily chart

면책사항
해당 정보와 게시물은 금융, 투자, 트레이딩 또는 기타 유형의 조언이나 권장 사항으로 간주되지 않으며, 트레이딩뷰에서 제공하거나 보증하는 것이 아닙니다. 자세한 내용은 이용 약관을 참조하세요.
면책사항
해당 정보와 게시물은 금융, 투자, 트레이딩 또는 기타 유형의 조언이나 권장 사항으로 간주되지 않으며, 트레이딩뷰에서 제공하거나 보증하는 것이 아닙니다. 자세한 내용은 이용 약관을 참조하세요.