
Past Performance of Tezos
The dominant trend in the short term is bullish. Gleaned from the formation in the daily chart, buyers have the upper hand. Risk-off swing traders may find loading opportunities to buy the dips with targets at immediate key resistance levels. In the past 24 hours, XTZ is up four percent and stable in the previous trading week.
#Tezos Technical Analysis
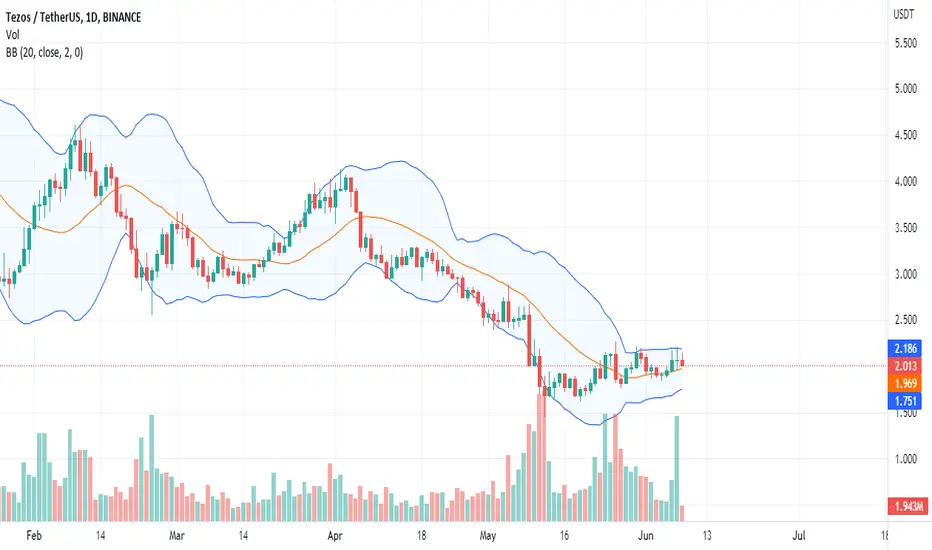
Tezos is inching higher, trending inside a rising channel above the middle BB in a bullish breakout formation. Even though prices are within an ascending channel, traders may find entries to buy Tezos above the flexible support line and $1.80. On the other hand, risk-averse traders can wait for a clean break above $2.2 and last week's highs before riding the wave with targets at $2.5 in a possible retest. A recovery is likely following the 57 percent correction from 2022 highs. Depending on the reaction at $2.5, the move up would be a retest or a buy trend continuation pattern. Conversely, losses below $1.80 and the ascending channel would invalidate the bullish preview, setting sellers in motion.
What to Expect from #XTZ?
Buyers are optimistic, as per the arrangement in the daily chart. However, a close above $2.2 will be crucial in determining the immediate term price trajectory following double-digit losses from the beginning of the year.
Resistance level to watch out for: $2.2
Support level to watch out for: $1.8
Disclaimer: Opinions expressed are not investment advice. Do your research.
The dominant trend in the short term is bullish. Gleaned from the formation in the daily chart, buyers have the upper hand. Risk-off swing traders may find loading opportunities to buy the dips with targets at immediate key resistance levels. In the past 24 hours, XTZ is up four percent and stable in the previous trading week.
#Tezos Technical Analysis
Tezos is inching higher, trending inside a rising channel above the middle BB in a bullish breakout formation. Even though prices are within an ascending channel, traders may find entries to buy Tezos above the flexible support line and $1.80. On the other hand, risk-averse traders can wait for a clean break above $2.2 and last week's highs before riding the wave with targets at $2.5 in a possible retest. A recovery is likely following the 57 percent correction from 2022 highs. Depending on the reaction at $2.5, the move up would be a retest or a buy trend continuation pattern. Conversely, losses below $1.80 and the ascending channel would invalidate the bullish preview, setting sellers in motion.
What to Expect from #XTZ?
Buyers are optimistic, as per the arrangement in the daily chart. However, a close above $2.2 will be crucial in determining the immediate term price trajectory following double-digit losses from the beginning of the year.
Resistance level to watch out for: $2.2
Support level to watch out for: $1.8
Disclaimer: Opinions expressed are not investment advice. Do your research.

관련 발행물
면책사항
해당 정보와 게시물은 금융, 투자, 트레이딩 또는 기타 유형의 조언이나 권장 사항으로 간주되지 않으며, 트레이딩뷰에서 제공하거나 보증하는 것이 아닙니다. 자세한 내용은 이용 약관을 참조하세요.
면책사항
해당 정보와 게시물은 금융, 투자, 트레이딩 또는 기타 유형의 조언이나 권장 사항으로 간주되지 않으며, 트레이딩뷰에서 제공하거나 보증하는 것이 아닙니다. 자세한 내용은 이용 약관을 참조하세요.