롱
VERGE Double Bottom ?
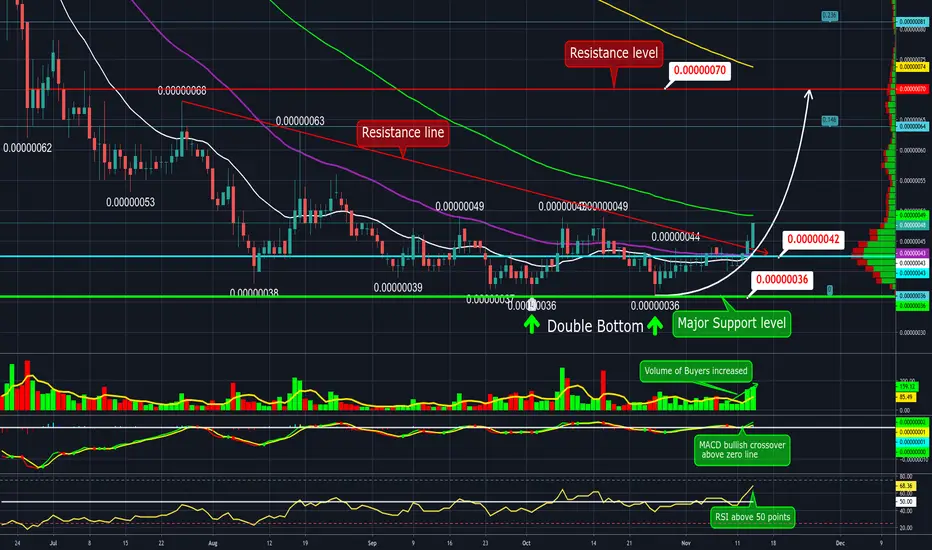
Verge price action above red resistance line breakout. Hodl above EMA 21,50 on daily TF. Testing EMA 100 which acting like resistance. Potential target 70 sats Resistance level.
Volume: of buyers increased.
Indicators: MACD bullish crossover above zero line. RSI above 50 points. Bullish sign.
Pattern: double bottom pattern at 36 sats.
S/R: Major Support 36 sats, Support 40 sats. Resistance 50 sats, Major Resistance 70 sats.
Disclaimer: THIS IS NOT FINANCIAL ADVICE. All the information shared here is for learning and entertainment purposes only.
Volume: of buyers increased.
Indicators: MACD bullish crossover above zero line. RSI above 50 points. Bullish sign.
Pattern: double bottom pattern at 36 sats.
S/R: Major Support 36 sats, Support 40 sats. Resistance 50 sats, Major Resistance 70 sats.
Disclaimer: THIS IS NOT FINANCIAL ADVICE. All the information shared here is for learning and entertainment purposes only.

면책사항
해당 정보와 게시물은 금융, 투자, 트레이딩 또는 기타 유형의 조언이나 권장 사항으로 간주되지 않으며, 트레이딩뷰에서 제공하거나 보증하는 것이 아닙니다. 자세한 내용은 이용 약관을 참조하세요.
면책사항
해당 정보와 게시물은 금융, 투자, 트레이딩 또는 기타 유형의 조언이나 권장 사항으로 간주되지 않으며, 트레이딩뷰에서 제공하거나 보증하는 것이 아닙니다. 자세한 내용은 이용 약관을 참조하세요.