업데이트됨
Verge Range Trading
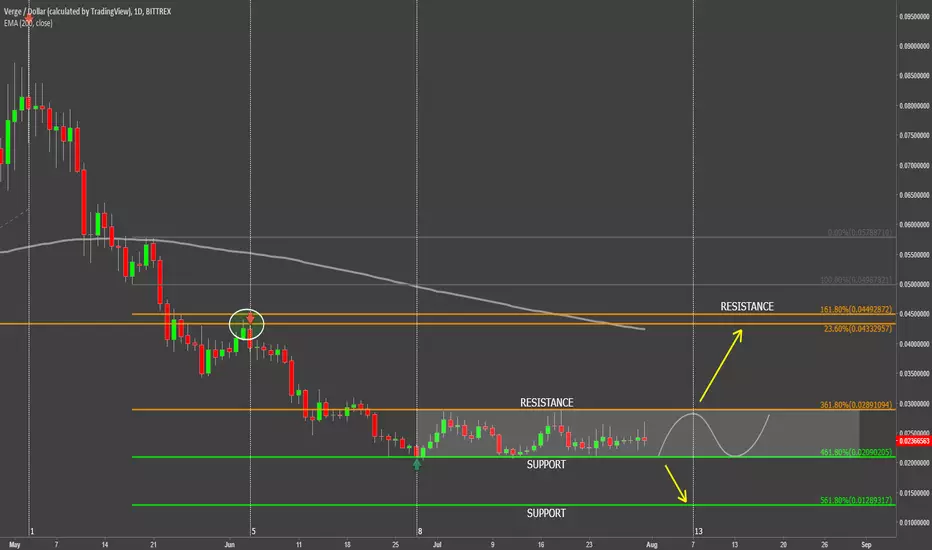
Since the beginning of May, Verge has been trading down and has reached the bottom on the 24th of June, when it hit the $0.02 low. After that the range trading has started, and currently XVG/USD has stuck between $0.029 resistance and $0.02 support.
There is absolutely no clarity of further price direction at this point. However, considering that the long term trend is down, it is still more likely that it will continue. But for that, weekly break and close below the $0.02 support is required.
When/if the support is broken, next support is seen at 561.8% Fibs, that is $0.012. And according to the Fibonacci time zone, the low can be reached around 7th of August.
On the upside, if the resistance is broken, it could be the first indication of a trend reversal, or at least a corrective wave up. In this case the upside target is seen neat $0.044 resistance area, that is 23.6% Fibs.
There is absolutely no clarity of further price direction at this point. However, considering that the long term trend is down, it is still more likely that it will continue. But for that, weekly break and close below the $0.02 support is required.
When/if the support is broken, next support is seen at 561.8% Fibs, that is $0.012. And according to the Fibonacci time zone, the low can be reached around 7th of August.
On the upside, if the resistance is broken, it could be the first indication of a trend reversal, or at least a corrective wave up. In this case the upside target is seen neat $0.044 resistance area, that is 23.6% Fibs.
거래청산: 타겟 닿음

면책사항
해당 정보와 게시물은 금융, 투자, 트레이딩 또는 기타 유형의 조언이나 권장 사항으로 간주되지 않으며, 트레이딩뷰에서 제공하거나 보증하는 것이 아닙니다. 자세한 내용은 이용 약관을 참조하세요.
면책사항
해당 정보와 게시물은 금융, 투자, 트레이딩 또는 기타 유형의 조언이나 권장 사항으로 간주되지 않으며, 트레이딩뷰에서 제공하거나 보증하는 것이 아닙니다. 자세한 내용은 이용 약관을 참조하세요.