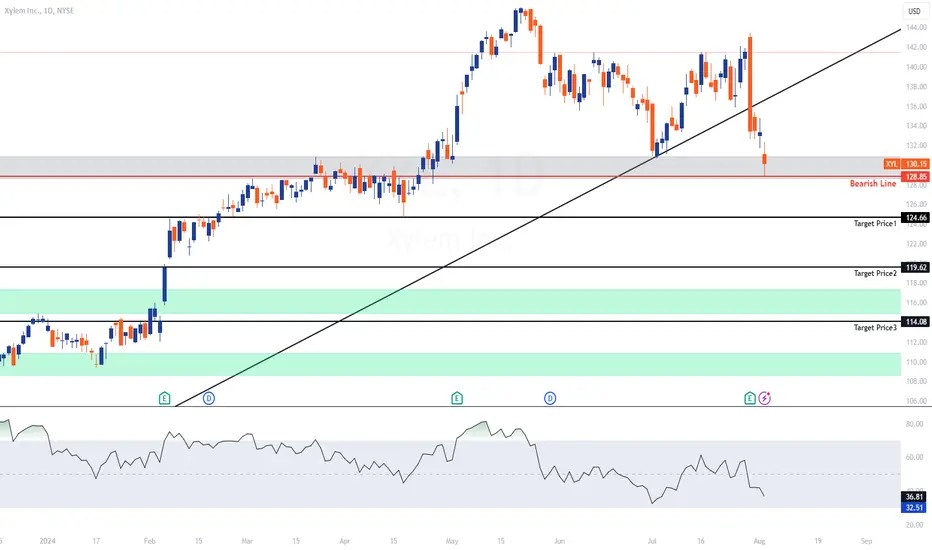
 XYL
Technical Analysis of Xylem Inc. (XYL)
Key Observations:
Current Price Action:
Price: $130.15
Recent Drop: -3.18 (-2.39%)
Support and Resistance Levels:
Immediate Support: $128.85 (Bearish Line)
Further Supports: $124.66 (Target Price 1), $119.62 (Target Price 2), and $114.08 (Target Price 3)
Resistance: The price has recently broken below a support level around $131.13.
Trendlines:
The price has broken below a key upward trendline, indicating a potential shift from a bullish to a bearish trend.
Relative Strength Index (RSI):
Current RSI: 36.81
The RSI is nearing the oversold zone, indicating increasing selling pressure and potential for further declines.
Target Prices:
Target Price 1: $124.66
This level is the immediate support and a potential first target for any continued downward movement.
Target Price 2: $119.62
If the price breaks below the immediate support, the next target is around $119.62, a previous support level.
Target Price 3: $114.08
Further downside could see the price reaching $114.08, another key support level.
Summary:
Xylem Inc. (XYL) has experienced a significant drop, breaking below a key support level and its upward trendline. The next levels to watch are $128.85, $124.66, $119.62, and $114.08. The RSI indicates potential for further declines if market conditions remain negative.
거래청산: 타겟 닿음

no pain, no gain
Unveiling illusions, revealing wealth
Unveiling illusions, revealing wealth
면책사항
해당 정보와 게시물은 금융, 투자, 트레이딩 또는 기타 유형의 조언이나 권장 사항으로 간주되지 않으며, 트레이딩뷰에서 제공하거나 보증하는 것이 아닙니다. 자세한 내용은 이용 약관을 참조하세요.
no pain, no gain
Unveiling illusions, revealing wealth
Unveiling illusions, revealing wealth
면책사항
해당 정보와 게시물은 금융, 투자, 트레이딩 또는 기타 유형의 조언이나 권장 사항으로 간주되지 않으며, 트레이딩뷰에서 제공하거나 보증하는 것이 아닙니다. 자세한 내용은 이용 약관을 참조하세요.