YFIBTC - Case for Bulls
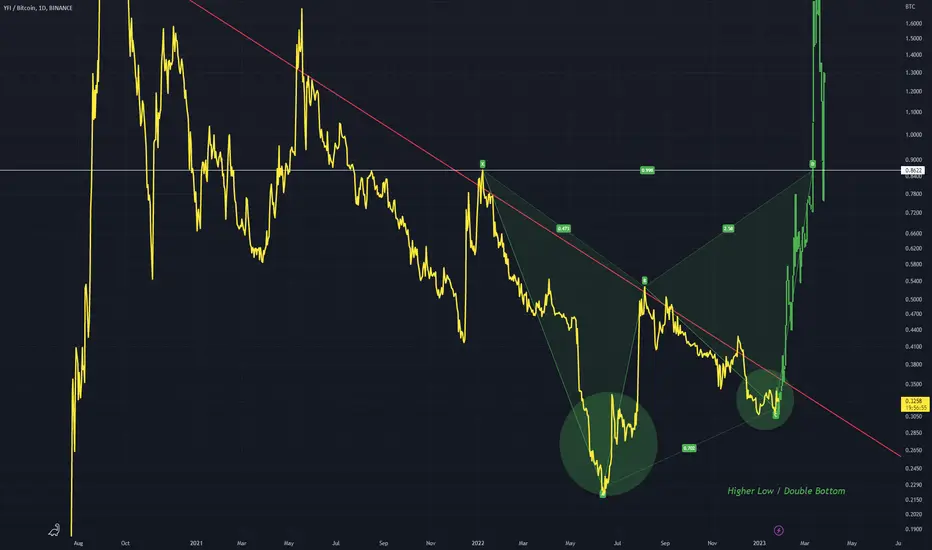
Currently this red trendline is dominant and should be considered when looking at this chart, as the dominant trend is down.
Ill give it a shot at picking the bottom though. A higher low and subsequent double bottom is a good candidate for a potential reversal
The ABCD pattern shows my thought process when looking at this chart structure
If price breaks down when the red line is hit then the bears are in control, but if it does breakout I expect it to move to D
Ill give it a shot at picking the bottom though. A higher low and subsequent double bottom is a good candidate for a potential reversal
The ABCD pattern shows my thought process when looking at this chart structure
If price breaks down when the red line is hit then the bears are in control, but if it does breakout I expect it to move to D

면책사항
해당 정보와 게시물은 금융, 투자, 트레이딩 또는 기타 유형의 조언이나 권장 사항으로 간주되지 않으며, 트레이딩뷰에서 제공하거나 보증하는 것이 아닙니다. 자세한 내용은 이용 약관을 참조하세요.
면책사항
해당 정보와 게시물은 금융, 투자, 트레이딩 또는 기타 유형의 조언이나 권장 사항으로 간주되지 않으며, 트레이딩뷰에서 제공하거나 보증하는 것이 아닙니다. 자세한 내용은 이용 약관을 참조하세요.