
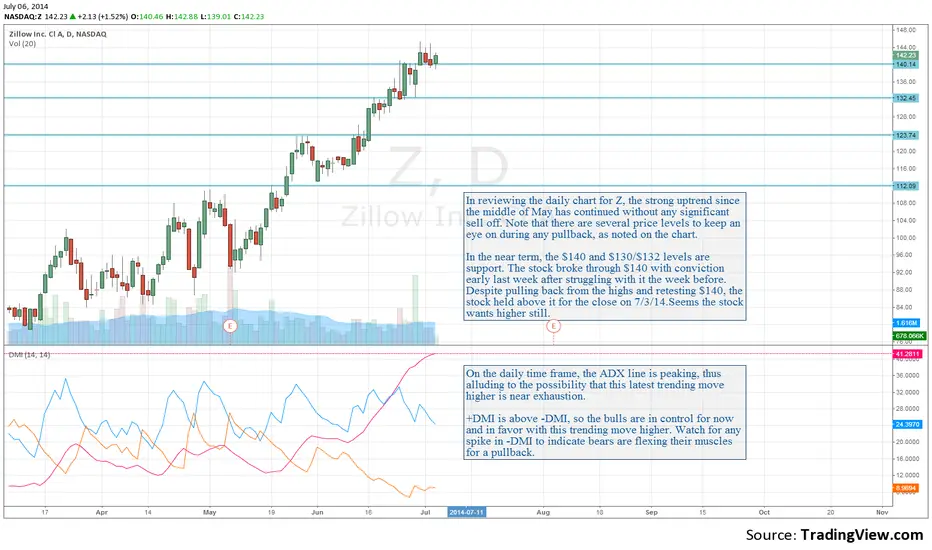
In reviewing the daily chart for Z, the strong uptrend since the middle of May has continued without any significant sell off. Note that there are several price levels to keep an eye on during any pullback, as noted on the chart.
In the near term, the $140 and $130/$132 levels are support. The stock broke through $140 with conviction early last week after struggling with it the week before. Despite pulling back from the highs and retesting $140, the stock held above it for the close on 7/3/14.Seems the stock wants higher still.
Blog post dated 07/05/2014: syncubate.com/blog/2014/7/6/zillow-trending-move-analysis
In the near term, the $140 and $130/$132 levels are support. The stock broke through $140 with conviction early last week after struggling with it the week before. Despite pulling back from the highs and retesting $140, the stock held above it for the close on 7/3/14.Seems the stock wants higher still.
Blog post dated 07/05/2014: syncubate.com/blog/2014/7/6/zillow-trending-move-analysis

면책사항
해당 정보와 게시물은 금융, 투자, 트레이딩 또는 기타 유형의 조언이나 권장 사항으로 간주되지 않으며, 트레이딩뷰에서 제공하거나 보증하는 것이 아닙니다. 자세한 내용은 이용 약관을 참조하세요.
면책사항
해당 정보와 게시물은 금융, 투자, 트레이딩 또는 기타 유형의 조언이나 권장 사항으로 간주되지 않으며, 트레이딩뷰에서 제공하거나 보증하는 것이 아닙니다. 자세한 내용은 이용 약관을 참조하세요.