
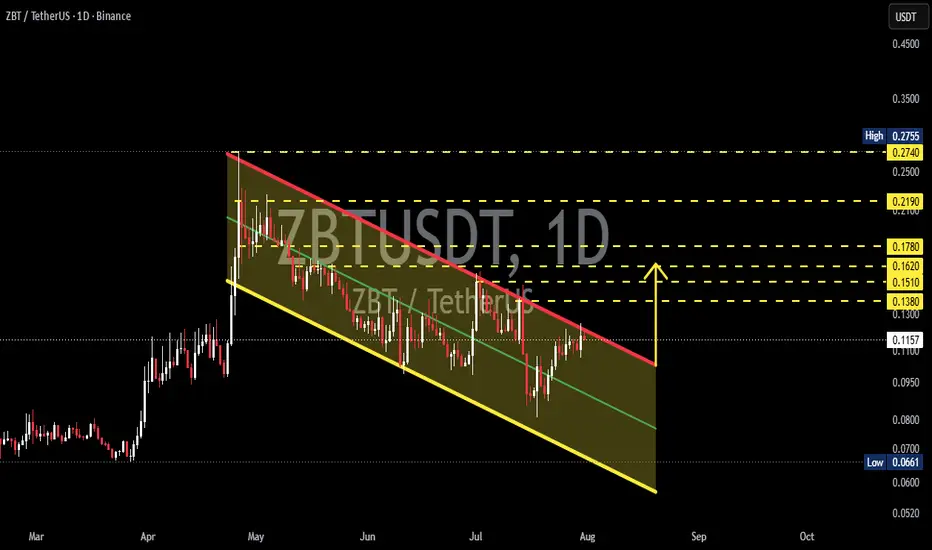
📊 Technical Analysis
💰 Coin: $ZBT #ZBT
⏳ Time Frame: 1D
📉 Pattern: Descending Channel (Bullish Reversal Setup)
🎯 Market Bias: Neutral to Bullish (Breakout Confirmation Required)
---
📌 Pattern Analysis
🔻 Descending Channel
ZBT is still trading inside a Descending Channel, a pattern formed by a series of lower highs and lower lows. Although this structure reflects short-term bearish pressure, a Descending Channel is often considered a bullish reversal pattern if the price successfully breaks above the upper resistance trendline with strong volume.
📍 At the moment, the price is approaching the upper trendline resistance, making this a critical decision zone for the next major move.
---
🟢 Bullish Scenario
✅ If ZBT successfully breaks above the red trendline and closes a daily candle above it, the probability of a trend reversal will increase significantly.
🎯 Potential upside targets:
🟡 0.1380 USDT
Initial resistance after the breakout.
🟡 0.1510 USDT
First major supply zone.
🟡 0.1620 USDT
Intermediate resistance level.
🟡 0.1780 USDT
Next bullish target if momentum remains strong.
🟡 0.2190 USDT
Major resistance where profit-taking may occur.
🟡 0.2740 USDT
Primary upside target and the previous swing high.
📈 A breakout supported by strong trading volume would significantly increase the probability of a new uptrend.
---
🔴 Bearish Scenario
❌ If the price gets rejected at the upper trendline and fails to break out, the Descending Channel will remain valid.
⚠️ In that case, the price may:
🔻 Retrace toward the channel midline, which acts as dynamic support.
🔻 Continue declining toward the lower trendline.
🔻 If the lower support is broken, selling pressure could intensify, leading to a deeper correction.
📉 As long as the channel resistance remains intact, traders should remain cautious of continued bearish momentum.
---
🔍 Key Levels
🟢 Resistance:
0.1380
0.1510
0.1620
0.1780
0.2190
0.2740
🔴 Support:
Descending Channel Midline
Descending Channel Lower Trendline
Previous Low around 0.0661
---
⚡ Trading Insight
💡 A Descending Channel frequently results in a bullish breakout, but confirmation is the key factor.
📊 Watch for:
✅ A daily candle closing above the resistance trendline.
✅ Increasing trading volume during the breakout.
✅ A successful retest of the broken resistance as new support.
Without these confirmations, the price may continue moving sideways or remain within the descending channel.
---
🎯 Conclusion
🚀 ZBT is currently trading at a critical decision point.
📈 A confirmed breakout from the Descending Channel could open the door for a rally toward the 0.1380–0.2740 USDT resistance zone.
📉 However, if the breakout fails, the price may remain inside the channel and retest the lower support levels.
⚠️ Always wait for breakout confirmation before making any trading decisions, as this area will likely determine ZBT's next major trend.
#ZBT #ZBTUSDT #Crypto #Cryptocurrency #Altcoin #TechnicalAnalysis #TradingView #Binance #PriceAction #DescendingChannel #Breakout #Bullish #Bearish #Support #Resistance #CryptoTrading #ChartAnalysis #Altcoins
💰 Coin: $ZBT #ZBT
⏳ Time Frame: 1D
📉 Pattern: Descending Channel (Bullish Reversal Setup)
🎯 Market Bias: Neutral to Bullish (Breakout Confirmation Required)
---
📌 Pattern Analysis
🔻 Descending Channel
ZBT is still trading inside a Descending Channel, a pattern formed by a series of lower highs and lower lows. Although this structure reflects short-term bearish pressure, a Descending Channel is often considered a bullish reversal pattern if the price successfully breaks above the upper resistance trendline with strong volume.
📍 At the moment, the price is approaching the upper trendline resistance, making this a critical decision zone for the next major move.
---
🟢 Bullish Scenario
✅ If ZBT successfully breaks above the red trendline and closes a daily candle above it, the probability of a trend reversal will increase significantly.
🎯 Potential upside targets:
🟡 0.1380 USDT
Initial resistance after the breakout.
🟡 0.1510 USDT
First major supply zone.
🟡 0.1620 USDT
Intermediate resistance level.
🟡 0.1780 USDT
Next bullish target if momentum remains strong.
🟡 0.2190 USDT
Major resistance where profit-taking may occur.
🟡 0.2740 USDT
Primary upside target and the previous swing high.
📈 A breakout supported by strong trading volume would significantly increase the probability of a new uptrend.
---
🔴 Bearish Scenario
❌ If the price gets rejected at the upper trendline and fails to break out, the Descending Channel will remain valid.
⚠️ In that case, the price may:
🔻 Retrace toward the channel midline, which acts as dynamic support.
🔻 Continue declining toward the lower trendline.
🔻 If the lower support is broken, selling pressure could intensify, leading to a deeper correction.
📉 As long as the channel resistance remains intact, traders should remain cautious of continued bearish momentum.
---
🔍 Key Levels
🟢 Resistance:
0.1380
0.1510
0.1620
0.1780
0.2190
0.2740
🔴 Support:
Descending Channel Midline
Descending Channel Lower Trendline
Previous Low around 0.0661
---
⚡ Trading Insight
💡 A Descending Channel frequently results in a bullish breakout, but confirmation is the key factor.
📊 Watch for:
✅ A daily candle closing above the resistance trendline.
✅ Increasing trading volume during the breakout.
✅ A successful retest of the broken resistance as new support.
Without these confirmations, the price may continue moving sideways or remain within the descending channel.
---
🎯 Conclusion
🚀 ZBT is currently trading at a critical decision point.
📈 A confirmed breakout from the Descending Channel could open the door for a rally toward the 0.1380–0.2740 USDT resistance zone.
📉 However, if the breakout fails, the price may remain inside the channel and retest the lower support levels.
⚠️ Always wait for breakout confirmation before making any trading decisions, as this area will likely determine ZBT's next major trend.
#ZBT #ZBTUSDT #Crypto #Cryptocurrency #Altcoin #TechnicalAnalysis #TradingView #Binance #PriceAction #DescendingChannel #Breakout #Bullish #Bearish #Support #Resistance #CryptoTrading #ChartAnalysis #Altcoins

✅ Get Free Signals! Join Our Telegram Channel Here: t.me/TheCryptoNuclear
✅ Twitter: twitter.com/crypto_nuclear
✅ Join Bybit : partner.bybit.com/b/nuclearvip
✅ Benefits : Lifetime Trading Fee Discount -50%
✅ Twitter: twitter.com/crypto_nuclear
✅ Join Bybit : partner.bybit.com/b/nuclearvip
✅ Benefits : Lifetime Trading Fee Discount -50%
면책사항
해당 정보와 게시물은 금융, 투자, 트레이딩 또는 기타 유형의 조언이나 권장 사항으로 간주되지 않으며, 트레이딩뷰에서 제공하거나 보증하는 것이 아닙니다. 자세한 내용은 이용 약관을 참조하세요.
✅ Get Free Signals! Join Our Telegram Channel Here: t.me/TheCryptoNuclear
✅ Twitter: twitter.com/crypto_nuclear
✅ Join Bybit : partner.bybit.com/b/nuclearvip
✅ Benefits : Lifetime Trading Fee Discount -50%
✅ Twitter: twitter.com/crypto_nuclear
✅ Join Bybit : partner.bybit.com/b/nuclearvip
✅ Benefits : Lifetime Trading Fee Discount -50%
면책사항
해당 정보와 게시물은 금융, 투자, 트레이딩 또는 기타 유형의 조언이나 권장 사항으로 간주되지 않으며, 트레이딩뷰에서 제공하거나 보증하는 것이 아닙니다. 자세한 내용은 이용 약관을 참조하세요.