
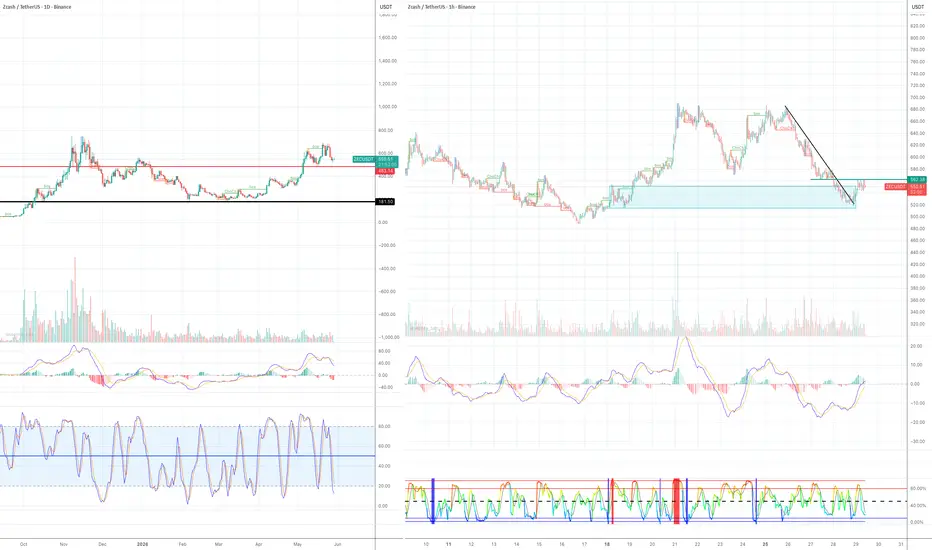
Zcash is a highly volatile asset, so I try not to focus too much on the noise in the lower time frames. My trading decisions are primarily based on the monthly and weekly charts. As I mentioned in my previous article, I do not intend to take significant profits until I see a clear bearish divergence on the weekly chart.
The price has pulled back sharply in recent days, and many traders are now discussing the possibility of a double-top pattern or the early stages of a head-and-shoulders formation. Based purely on chart pattern analysis, these scenarios could imply a much deeper correction.
However, at this stage, I want to see whether the daily candle can close above the previous lower high at $483 (red horizontal line in Daily chart). Daily Stochastic may also be forming a hidden bullish divergence, although this has not yet been confirmed.
On the 1-hour chart, MACD has started to enter bullish territory. While the signal remains relatively weak, there are early signs that the price may be attempting to establish a higher high and a higher low.
For now, I will remain patient and observe how the price action develops over the next few days. The monthly candle is also due to close soon, and that will be an important signal to monitor before making any further decisions.

관련 발행물
면책사항
해당 정보와 게시물은 금융, 투자, 트레이딩 또는 기타 유형의 조언이나 권장 사항으로 간주되지 않으며, 트레이딩뷰에서 제공하거나 보증하는 것이 아닙니다. 자세한 내용은 이용 약관을 참조하세요.
관련 발행물
면책사항
해당 정보와 게시물은 금융, 투자, 트레이딩 또는 기타 유형의 조언이나 권장 사항으로 간주되지 않으며, 트레이딩뷰에서 제공하거나 보증하는 것이 아닙니다. 자세한 내용은 이용 약관을 참조하세요.