
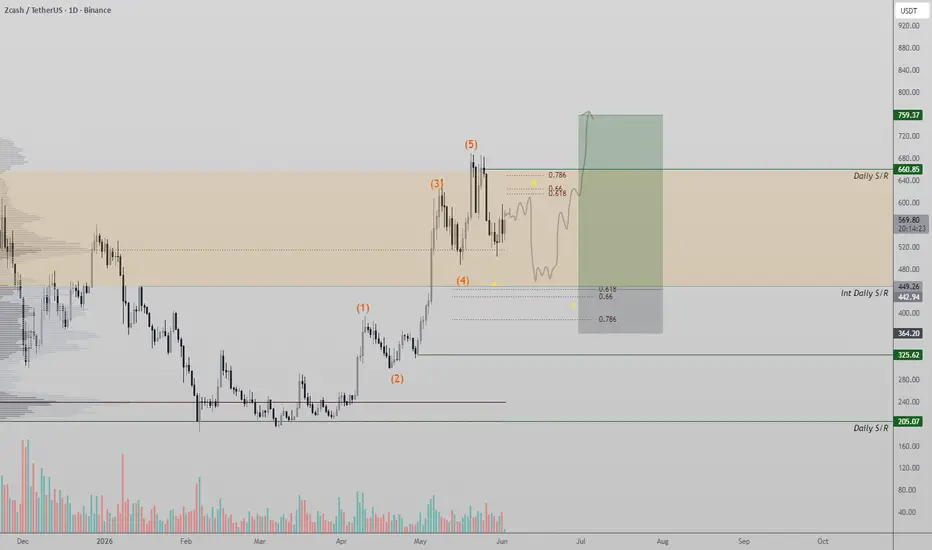
Zcash (ZEC) price action continues to maintain a constructive higher-timeframe structure despite undergoing a short-term correction. From an Elliott Wave perspective, the market appears to have completed a clear five-wave impulsive advance to the upside, signaling strong bullish participation and confirming a positive trend throughout the previous expansion phase.
Following the completion of this impulsive sequence, price has entered what appears to be a standard corrective phase. Current market behavior is closely resembling an ABC correction, which is a common retracement pattern that often develops after a completed five-wave move. As a result, the probability of further downside within the correction remains elevated before the broader trend resumes.
The most important area to monitor is the 0.618 Fibonacci retracement level, which aligns with an internal daily support and resistance zone. This technical confluence creates a high-probability support region where buyers may look to re-enter the market. Should price successfully establish support within this area, it would reinforce the validity of the corrective structure and increase the likelihood of a rotation back toward the recent highs.
A successful reaction from support would preserve the overall bullish market structure and potentially mark the beginning of a larger impulsive wave higher. Until that support region is tested and confirmed, ZEC remains corrective in the short term, with an ABC retracement likely developing before the next phase of bullish expansion begins.(ZEC) price action continues to maintain a constructive higher-timeframe structure despite undergoing a short-term correction. From an Elliott Wave perspective, the market appears to have completed a clear five-wave impulsive advance to the upside, signaling strong bullish participation and confirming a positive trend throughout the previous expansion phase.
Following the completion of this impulsive sequence, price has entered what appears to be a standard corrective phase. Current market behavior is closely resembling an ABC correction, which is a common retracement pattern that often develops after a completed five-wave move. As a result, the probability of further downside within the correction remains elevated before the broader trend resumes.
The most important area to monitor is the 0.618 Fibonacci retracement level, which aligns with an internal daily support and resistance zone. This technical confluence creates a high-probability support region where buyers may look to re-enter the market. Should price successfully establish support within this area, it would reinforce the validity of the corrective structure and increase the likelihood of a rotation back toward the recent highs.
A successful reaction from support would preserve the overall bullish market structure and potentially mark the beginning of a larger impulsive wave higher. Until that support region is tested and confirmed, ZEC remains corrective in the short term, with an ABC retracement likely developing before the next phase of bullish expansion begins.
Following the completion of this impulsive sequence, price has entered what appears to be a standard corrective phase. Current market behavior is closely resembling an ABC correction, which is a common retracement pattern that often develops after a completed five-wave move. As a result, the probability of further downside within the correction remains elevated before the broader trend resumes.
The most important area to monitor is the 0.618 Fibonacci retracement level, which aligns with an internal daily support and resistance zone. This technical confluence creates a high-probability support region where buyers may look to re-enter the market. Should price successfully establish support within this area, it would reinforce the validity of the corrective structure and increase the likelihood of a rotation back toward the recent highs.
A successful reaction from support would preserve the overall bullish market structure and potentially mark the beginning of a larger impulsive wave higher. Until that support region is tested and confirmed, ZEC remains corrective in the short term, with an ABC retracement likely developing before the next phase of bullish expansion begins.(ZEC) price action continues to maintain a constructive higher-timeframe structure despite undergoing a short-term correction. From an Elliott Wave perspective, the market appears to have completed a clear five-wave impulsive advance to the upside, signaling strong bullish participation and confirming a positive trend throughout the previous expansion phase.
Following the completion of this impulsive sequence, price has entered what appears to be a standard corrective phase. Current market behavior is closely resembling an ABC correction, which is a common retracement pattern that often develops after a completed five-wave move. As a result, the probability of further downside within the correction remains elevated before the broader trend resumes.
The most important area to monitor is the 0.618 Fibonacci retracement level, which aligns with an internal daily support and resistance zone. This technical confluence creates a high-probability support region where buyers may look to re-enter the market. Should price successfully establish support within this area, it would reinforce the validity of the corrective structure and increase the likelihood of a rotation back toward the recent highs.
A successful reaction from support would preserve the overall bullish market structure and potentially mark the beginning of a larger impulsive wave higher. Until that support region is tested and confirmed, ZEC remains corrective in the short term, with an ABC retracement likely developing before the next phase of bullish expansion begins.

Join the Free Trading Group
Telegram: t.me/freetradingden 🔥
Claim $1000 Deposit Bonus 🎁
Trade with perks & support the community!
partner.blofin.com/d/TheAlchemist
Stay sharp, trade smart.
— Team The Alchemist ⚔️
Telegram: t.me/freetradingden 🔥
Claim $1000 Deposit Bonus 🎁
Trade with perks & support the community!
partner.blofin.com/d/TheAlchemist
Stay sharp, trade smart.
— Team The Alchemist ⚔️
면책사항
해당 정보와 게시물은 금융, 투자, 트레이딩 또는 기타 유형의 조언이나 권장 사항으로 간주되지 않으며, 트레이딩뷰에서 제공하거나 보증하는 것이 아닙니다. 자세한 내용은 이용 약관을 참조하세요.
Join the Free Trading Group
Telegram: t.me/freetradingden 🔥
Claim $1000 Deposit Bonus 🎁
Trade with perks & support the community!
partner.blofin.com/d/TheAlchemist
Stay sharp, trade smart.
— Team The Alchemist ⚔️
Telegram: t.me/freetradingden 🔥
Claim $1000 Deposit Bonus 🎁
Trade with perks & support the community!
partner.blofin.com/d/TheAlchemist
Stay sharp, trade smart.
— Team The Alchemist ⚔️
면책사항
해당 정보와 게시물은 금융, 투자, 트레이딩 또는 기타 유형의 조언이나 권장 사항으로 간주되지 않으며, 트레이딩뷰에서 제공하거나 보증하는 것이 아닙니다. 자세한 내용은 이용 약관을 참조하세요.