
Hi Traders,
We have a mixed opinion on this stock, but will definitely add to our watchlist.
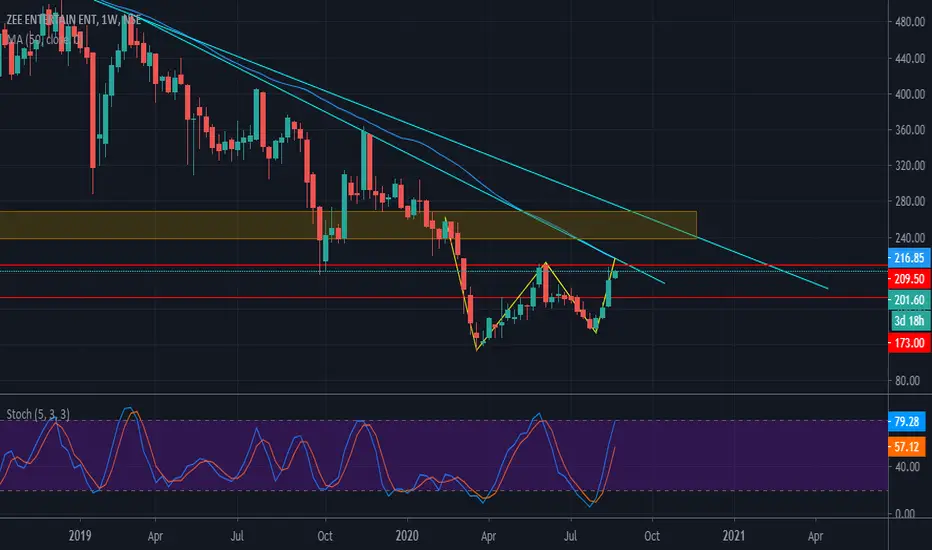
The weekly chart shows that this stock has been in a downtrend since jun 2018, and price is forming a double bottom pattern which indicates the end of this downtrend.
The stock price is approaching key resistance point at 209.50, which came in confluence with the inner trendline. A break of this trendline can result in price testing the outer trendline.
The golden zone is between 239 - 268.50 which can play as a resistance zone.
We can expect 300 levels on this counter by mid 2021, if we get a break of the outer trendline.
On a short term perspective, how the price reacts at 209.50 and the inner trendline will be a decision maker.
For this kind of complete technical analysis msg me the stocks that u would like to have complete technical analysis .
Pls Like and follow.
Happy Trading.....
We have a mixed opinion on this stock, but will definitely add to our watchlist.
The weekly chart shows that this stock has been in a downtrend since jun 2018, and price is forming a double bottom pattern which indicates the end of this downtrend.
The stock price is approaching key resistance point at 209.50, which came in confluence with the inner trendline. A break of this trendline can result in price testing the outer trendline.
The golden zone is between 239 - 268.50 which can play as a resistance zone.
We can expect 300 levels on this counter by mid 2021, if we get a break of the outer trendline.
On a short term perspective, how the price reacts at 209.50 and the inner trendline will be a decision maker.
For this kind of complete technical analysis msg me the stocks that u would like to have complete technical analysis .
Pls Like and follow.
Happy Trading.....

면책사항
해당 정보와 게시물은 금융, 투자, 트레이딩 또는 기타 유형의 조언이나 권장 사항으로 간주되지 않으며, 트레이딩뷰에서 제공하거나 보증하는 것이 아닙니다. 자세한 내용은 이용 약관을 참조하세요.
면책사항
해당 정보와 게시물은 금융, 투자, 트레이딩 또는 기타 유형의 조언이나 권장 사항으로 간주되지 않으며, 트레이딩뷰에서 제공하거나 보증하는 것이 아닙니다. 자세한 내용은 이용 약관을 참조하세요.