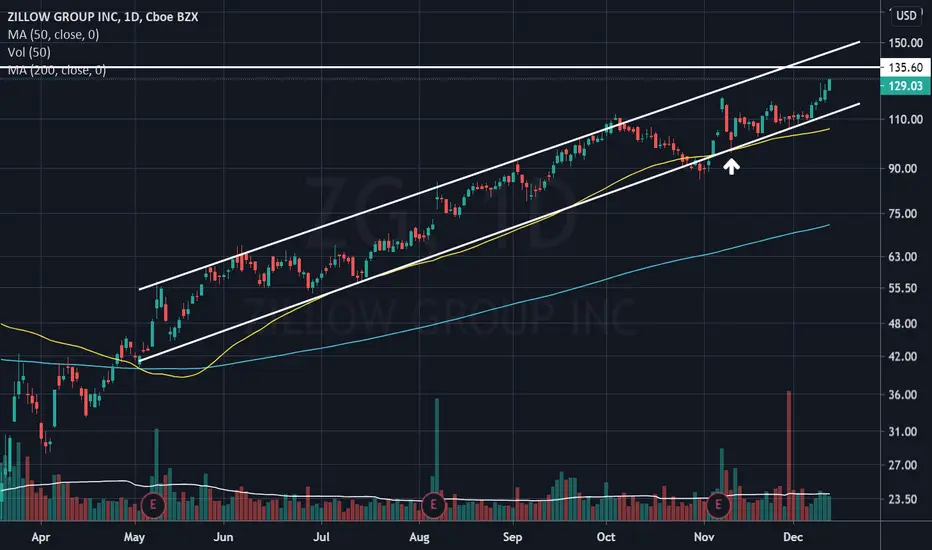
 ZG exhibited a well respected trend channel since April 2020, a significant 8 months duration. It underwent a technical sell off of -15.76%, on 9th November 2020, with price action being resisted at its upper trendline.
The exhaustion of the selling was witnessed during the afternoon session of 10th November 2020, with
ZG closing the day with a Bullish Reversal Hammer Candlestick Pattern (highlighted), coinciding with the lower band support of the trend channel.The continuation of this all time high breakout rally is likely to see
ZG test its upper trendline resistance at $135.00 in the upcoming week.
면책사항
해당 정보와 게시물은 금융, 투자, 트레이딩 또는 기타 유형의 조언이나 권장 사항으로 간주되지 않으며, 트레이딩뷰에서 제공하거나 보증하는 것이 아닙니다. 자세한 내용은 이용 약관을 참조하세요.
면책사항
해당 정보와 게시물은 금융, 투자, 트레이딩 또는 기타 유형의 조언이나 권장 사항으로 간주되지 않으며, 트레이딩뷰에서 제공하거나 보증하는 것이 아닙니다. 자세한 내용은 이용 약관을 참조하세요.