
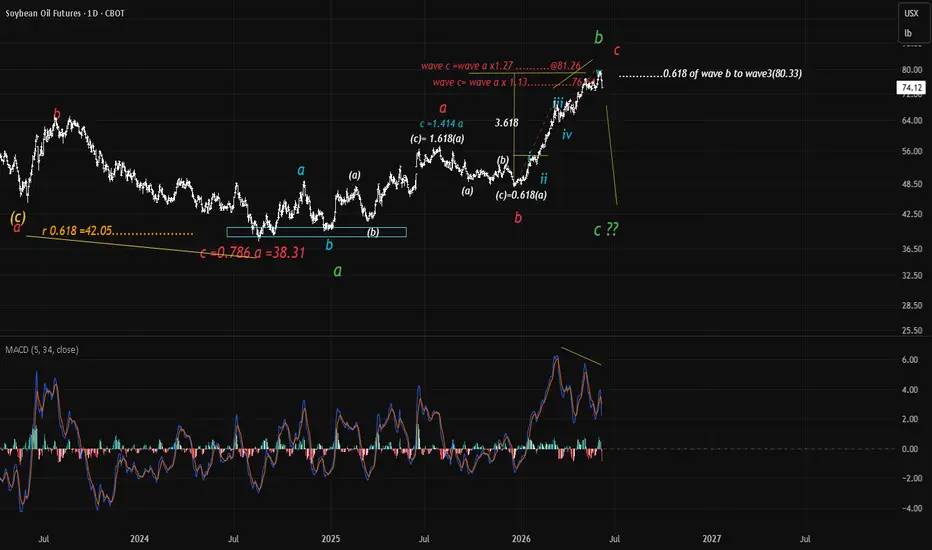
Since August 2024 market moved 111.6% over 448 trading days culminated in wave b of a larger degree to be followed by a move down for wave c.
Compelling indications of a high probable turn is seen with pronounced divergence between price and MACD followed by wave c(red) into a zone where 1.13 and 1.27 of wave a displayed loss of momentum and a 5-wave structure to complete wave c.
The wave relationship between wave v(0.618) to wave iii also fell in the resistive zone.
a 3.618 ratio from the top of wave i(blue) to wave v further adds weight to the topping possibility.
Weekly closing displayed a reversal minus which generally indicates a high chance of a reversal over and above the low closing.
A confirmation of the downturn is needed. Let the market unfold itself .
Compelling indications of a high probable turn is seen with pronounced divergence between price and MACD followed by wave c(red) into a zone where 1.13 and 1.27 of wave a displayed loss of momentum and a 5-wave structure to complete wave c.
The wave relationship between wave v(0.618) to wave iii also fell in the resistive zone.
a 3.618 ratio from the top of wave i(blue) to wave v further adds weight to the topping possibility.
Weekly closing displayed a reversal minus which generally indicates a high chance of a reversal over and above the low closing.
A confirmation of the downturn is needed. Let the market unfold itself .

면책사항
해당 정보와 게시물은 금융, 투자, 트레이딩 또는 기타 유형의 조언이나 권장 사항으로 간주되지 않으며, 트레이딩뷰에서 제공하거나 보증하는 것이 아닙니다. 자세한 내용은 이용 약관을 참조하세요.
면책사항
해당 정보와 게시물은 금융, 투자, 트레이딩 또는 기타 유형의 조언이나 권장 사항으로 간주되지 않으며, 트레이딩뷰에서 제공하거나 보증하는 것이 아닙니다. 자세한 내용은 이용 약관을 참조하세요.