ZRX - BreakDown!
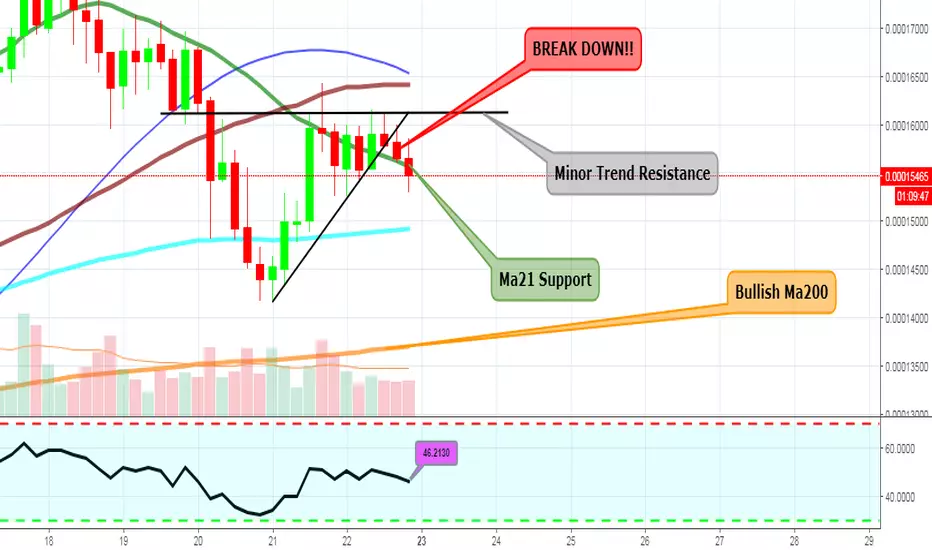
There is an ascending triangle ong 4h ZRX chart. You can see the indicators.
As i see, Ma21 working as a support and Ma50 will work as resistance.
RSI looks bearish but Ma200 looks bullish. Manage your own risk and be careful about the BTC movement.
As i see, Ma21 working as a support and Ma50 will work as resistance.
RSI looks bearish but Ma200 looks bullish. Manage your own risk and be careful about the BTC movement.

면책사항
해당 정보와 게시물은 금융, 투자, 트레이딩 또는 기타 유형의 조언이나 권장 사항으로 간주되지 않으며, 트레이딩뷰에서 제공하거나 보증하는 것이 아닙니다. 자세한 내용은 이용 약관을 참조하세요.
면책사항
해당 정보와 게시물은 금융, 투자, 트레이딩 또는 기타 유형의 조언이나 권장 사항으로 간주되지 않으며, 트레이딩뷰에서 제공하거나 보증하는 것이 아닙니다. 자세한 내용은 이용 약관을 참조하세요.