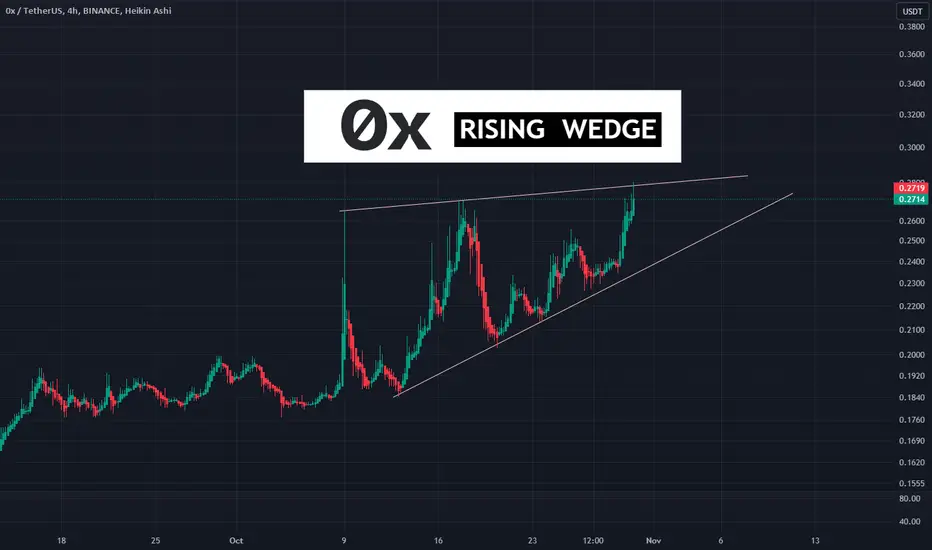

 ZRXUSDT is forming a rising wedge, or a bearish wedge potentially could see a reversal from a day trading standpoint.
In my technical analysis, the price has reached an essential key resistance level of $0.2720 or the .618 Fib retracement as shown in the chart below on a daily timeframe.
RSI indicator is showing a bearish divergence wherein it forms a lower high and the price forms a higher high.
Currently the price forms another higher high, the next resistance would be at $0.2967 if the price would push upwards based on the Fib retracement extension of 2.236. I could determine the next trendline as valid utilizing the back test process.
If you're looking to trade this coin NOW, use this diagonal support as guide. It also formed divergence as well.
If a breakdown confirmation happens, set partial take profits on the common support lines.
I will try to update on that :)
Always PLAN your trades and happy Halloween 🎃
노트
The diagonal support had a breakdown currently holding at the 0.5 Fibonacci level. 노트
Breakout on the rising wedge. Be cautious now on LONGing this coin since on an hourly timeframe (1h-4h) the price is overbought based on my indicators. If I'm gonna trade this, I would prefer long scalp.노트
Congratulations to those who entered on the MASSIVE breakout :)노트
노트
노트
Adjusted the wedge and still shows bearish divergence.노트
The price has touched again the diagonal support line upon the correlated selling of other coins. A reversal could happen if its breakout confirms on this resistance line.
Here is the triangle of life, I would not trade this coin for now and wait until we see a break scenario.
노트
I could see it happen TODAY or TOMORROW :)노트
Upon reviewing the scenario in the previous idea, the price had a breakout on the mini resistance line and determine a support at $0.2748. Notice also the current price for this post as it touches the near-month-long support line.Overall, this is my overall chart for ZRX for now. A breakdown can happen if we see another selling power in this market as it is on our support line. I will try to update been busy with my work lately :)

관련 발행물
면책사항
해당 정보와 게시물은 금융, 투자, 트레이딩 또는 기타 유형의 조언이나 권장 사항으로 간주되지 않으며, 트레이딩뷰에서 제공하거나 보증하는 것이 아닙니다. 자세한 내용은 이용 약관을 참조하세요.
관련 발행물
면책사항
해당 정보와 게시물은 금융, 투자, 트레이딩 또는 기타 유형의 조언이나 권장 사항으로 간주되지 않으며, 트레이딩뷰에서 제공하거나 보증하는 것이 아닙니다. 자세한 내용은 이용 약관을 참조하세요.