
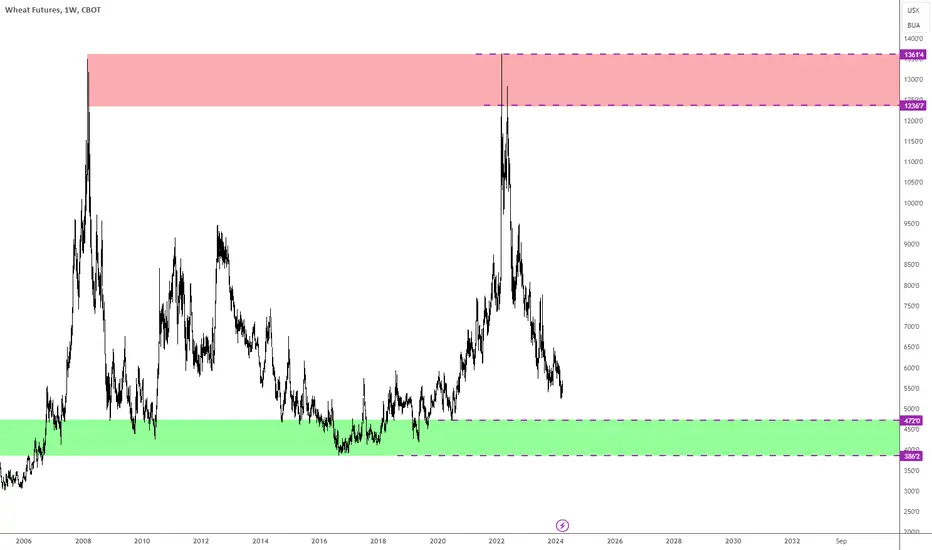
Supply and demand zones for Wheat on the weekly chart.
Once you enter the zone, look for the lower timeframe reversal patterns, extended waves, classic trendline breaks, etc.
Drop down to the Daily for refined supply and demand zones.
Drop down to 1 hour chart for the current trend after you see the reversal pattern.
Once you enter the zone, look for the lower timeframe reversal patterns, extended waves, classic trendline breaks, etc.
Drop down to the Daily for refined supply and demand zones.
Drop down to 1 hour chart for the current trend after you see the reversal pattern.

Chris Juliano
면책사항
해당 정보와 게시물은 금융, 투자, 트레이딩 또는 기타 유형의 조언이나 권장 사항으로 간주되지 않으며, 트레이딩뷰에서 제공하거나 보증하는 것이 아닙니다. 자세한 내용은 이용 약관을 참조하세요.
Chris Juliano
면책사항
해당 정보와 게시물은 금융, 투자, 트레이딩 또는 기타 유형의 조언이나 권장 사항으로 간주되지 않으며, 트레이딩뷰에서 제공하거나 보증하는 것이 아닙니다. 자세한 내용은 이용 약관을 참조하세요.