
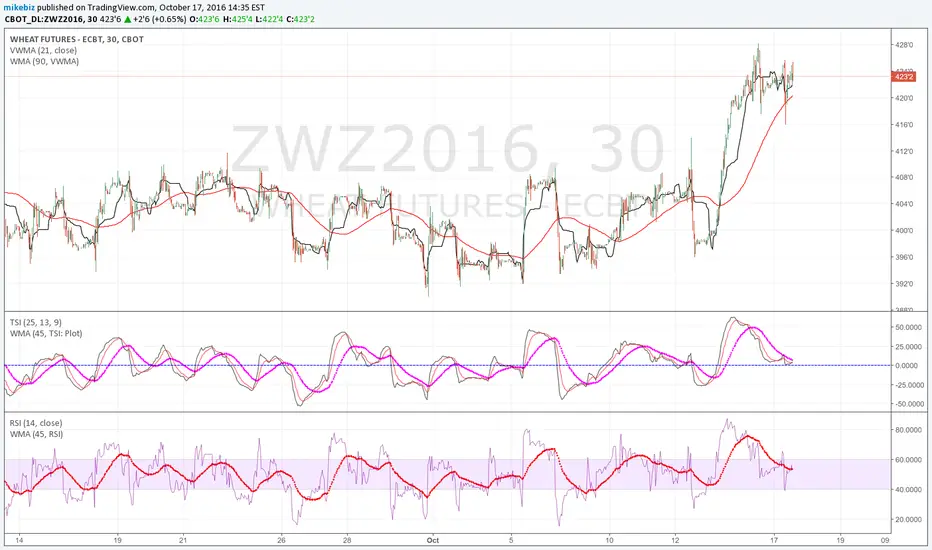
Looking at 30M chart, it's possible that wheat has made its pullback. The TSI could be finding support at 0 and RSI on 40. Based on next open and if these indicators move up off this support may try a dec wheat call.
Looking at the daily chart, the RSI and TSI look bullish and the ADX with +DMI looks like it could be setting up a change in dominance from down trend.

Daily looks like it hit some resistance at the 23.6% retrace area between the 6/8 high and 8/31 low. I think that price will move up to challenge other areas of retrace as noted on daily chart.
Looking at the daily chart, the RSI and TSI look bullish and the ADX with +DMI looks like it could be setting up a change in dominance from down trend.
Daily looks like it hit some resistance at the 23.6% retrace area between the 6/8 high and 8/31 low. I think that price will move up to challenge other areas of retrace as noted on daily chart.

관련 발행물
면책사항
해당 정보와 게시물은 금융, 투자, 트레이딩 또는 기타 유형의 조언이나 권장 사항으로 간주되지 않으며, 트레이딩뷰에서 제공하거나 보증하는 것이 아닙니다. 자세한 내용은 이용 약관을 참조하세요.
면책사항
해당 정보와 게시물은 금융, 투자, 트레이딩 또는 기타 유형의 조언이나 권장 사항으로 간주되지 않으며, 트레이딩뷰에서 제공하거나 보증하는 것이 아닙니다. 자세한 내용은 이용 약관을 참조하세요.