EUR/USD BULLISH BIAS RIGHT NOW| LONG
Hello, Friends!
Previous week’s red candle means that for us the EUR/USD pair is in the downtrend. And the current movement leg was also down but the support line will be hit soon and lower BB band proximity will signal an oversold condition so we will go for a counter-trend long trade with the target being at 1.142.
Disclosure: I am part of Trade Nation's Influencer program and receive a monthly fee for using their TradingView charts in my analysis.
✅LIKE AND COMMENT MY IDEAS✅
Bullish Patterns
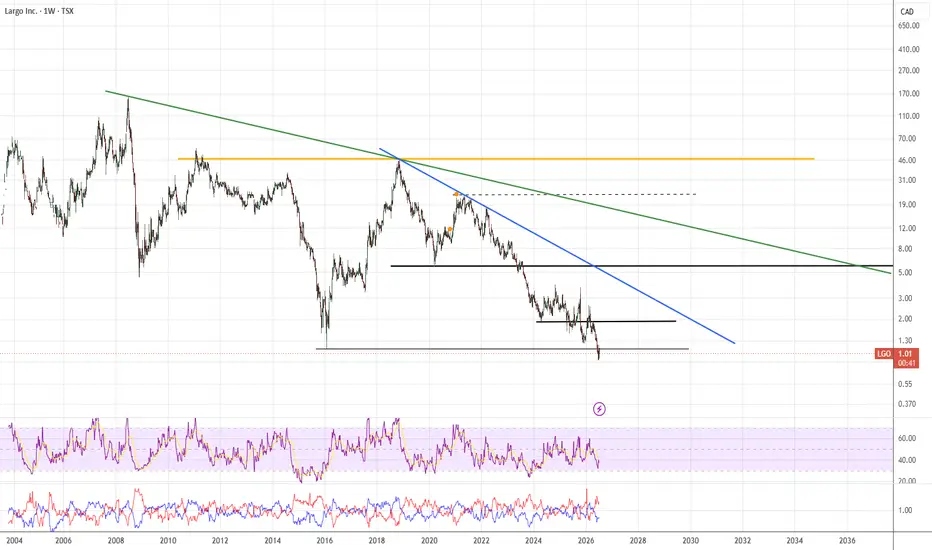
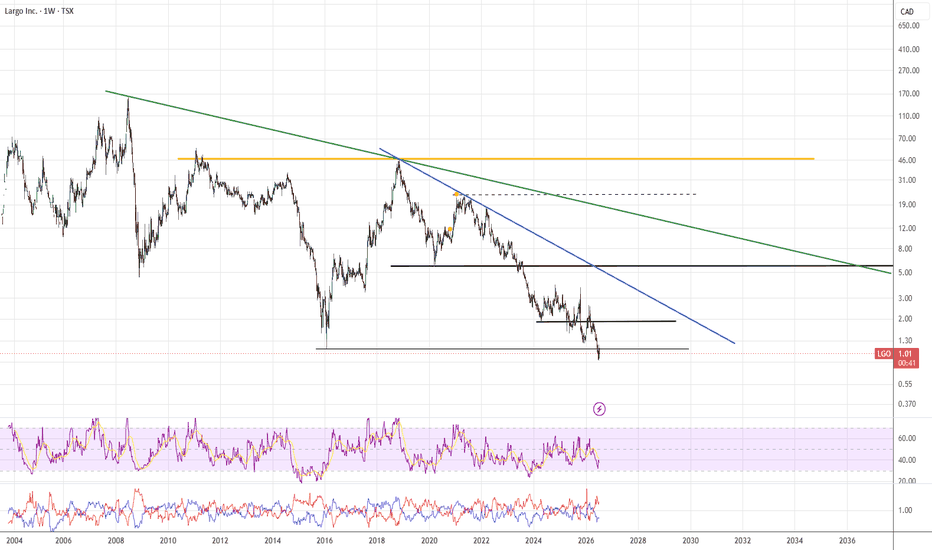
LGOLGO - with US DND contract and one of the lowest cost Vanadium producers + highest quality Vanadium mine in the world. this stock is positioned to rally to $5.64 for a test of resistance levels before the trend change to growth.
*** High volumes + strong fundamentals + improved revenue outlook + earned trust form government = strong case for a bull run
Cheers.
CHF/JPY BULLS WILL DOMINATE THE MARKET|LONG
Hello, Friends!
CHF/JPY pair is trading in a local uptrend which know by looking at the previous 1W candle which is green. On the 4H timeframe the pair is going down. The pair is oversold because the price is close to the lower band of the BB indicator. So we are looking to buy the pair with the lower BB line acting as support. The next target is 201.413 area.
Disclosure: I am part of Trade Nation's Influencer program and receive a monthly fee for using their TradingView charts in my analysis.
✅LIKE AND COMMENT MY IDEAS✅
NZDUSD - Oversold Zone AheadNZDUSD has been trading within a well-defined bearish channel, respecting the falling red trendline while printing lower highs and lower lows. 📉
After the latest decline, price is now approaching a major area where multiple technical factors converge.
Currently, NZDUSD is nearing the intersection of:
🔹 The lower bound of the falling red channel, acting as a non-horizontal oversold zone.
🔹 The blue weekly demand zone, which has previously attracted strong buying pressure.
When multiple support factors align at the same location, they often create high-probability reaction zones.
📌 As NZDUSD approaches this oversold confluence , we will be looking for medium-term long setups, anticipating that buyers may step in and trigger a meaningful bullish correction.
As always, patience is key. We will wait for proper bullish confirmation before considering any long positions.
Will NZDUSD find support and reverse from this oversold zone? 🤔
⚠️ Disclaimer: This is not financial advice. Always do your own research and manage risk properly.
📚 Stick to your trading plan regarding entries, risk, and management.
Good luck! 🍀
All Strategies Are Good; If Managed Properly!
~Richard Nasr
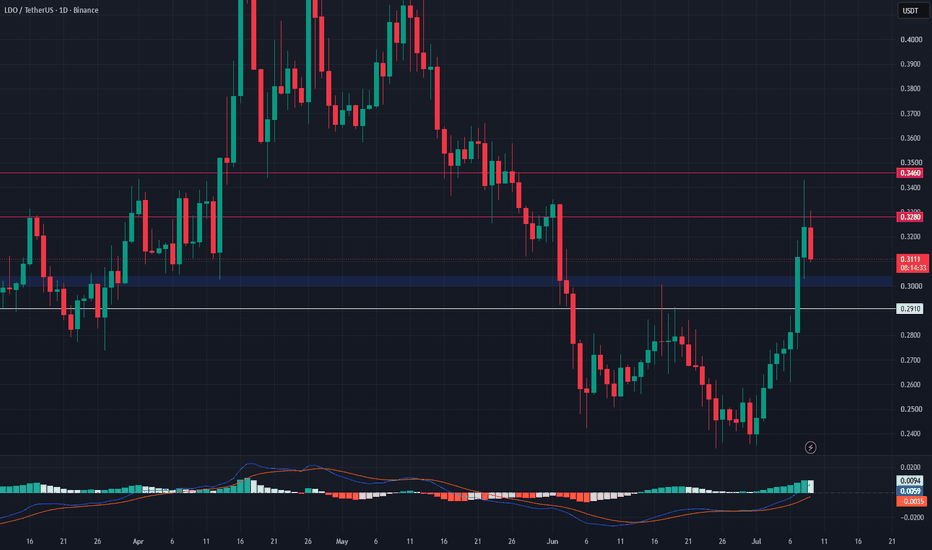
LDO Breakout Confirmed — Waiting for Pullback Toward SupportLDO has broken out of its recent consolidation range and reclaimed key resistance, which has now flipped into support.
Price is approaching resistance near $0.328, but a pullback toward the $0.300–$0.304 support zone may offer a better entry. If this zone holds, LDO could continue toward the next upside levels.
Trading Levels:
Entry Zone: $0.300 – $0.304
TP1: $0.328
TP2: $0.346
Stop Loss: $0.291
Bias: Bullish above support
AUDUSD is Nearing a Decent Support!Hey Traders, in today's trading session we are monitoring AUDUSD for a buying opportunity around 0.69100 zone, AUDUSD is trading in an uptrend and currently is in a correction phase in which it is approaching the trend at 0.69100 support and resistance area.
Trade safe, Joe.
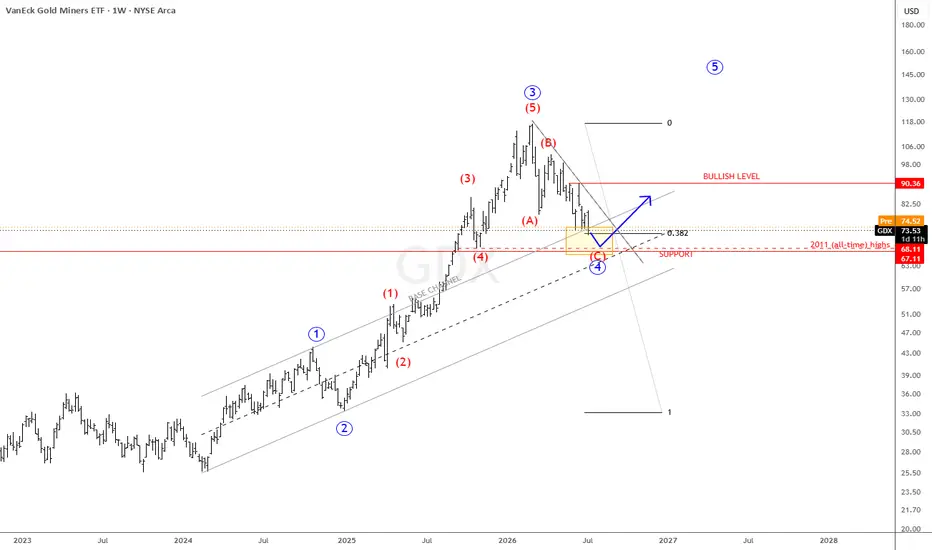
Gold Miners (GDX) Approaching Key Support ZoneGold and gold miners are now approaching important support zones that could define the next major market move. The weekly chart of the VanEck Gold Miners ETF (GDX) highlights a critical area where the ongoing wave 4 correction could potentially find support before the next impulsive advance begins.
GDX is approaching an attractive support zone formed by the 2021 all-time highs, the 38.2% Fibonacci retracement level, and the upper line of the base channel, which all converge around the 70–68 region. If this area holds, we could see buyers step back in and trigger the next impulsive move higher into wave 5.
However, while this support zone offers a potentially favorable setup, bullish confirmation would only come with a decisive break back above the trendline and the 90 level. Until then, the market remains within a corrective phase, with the next major direction likely determined by how price reacts around this key support area.
BTC — Bulls or bears? Decision time
🔥Bitcoin has pulled back after testing the resistance area highlighted in the previous analysis. As expected, sellers stepped in around that level, leading to a corrective move. Price is now trading near an important support zone that could determine the next major direction.
🛑Previously:
📈 Bullish scenario
If buyers successfully defend the current support and reclaim 64,000, we can expect another push toward 65,500, with the possibility of extending into the higher resistance zone if momentum strengthens.
📉 Bearish scenario
If price loses the current support and closes below 61,800, the correction could continue toward 60,000, with 57,700 becoming the next major downside target.
The previous resistance reacted exactly as expected, and now all attention shifts to the current support. The next breakout or breakdown should provide the next high-probability directional move.
Gold — More downside ahead?
🔥Gold has lost an important support area after a strong bearish impulse, confirming that sellers have regained short-term control. Price is now hovering above a key reaction zone where the next move could determine whether this decline extends or pauses for a temporary rebound.
🏆Previously:
📉 Bearish scenario
If sellers break below the current support, we can expect the downtrend to continue toward the next major demand zones. The overall structure remains bearish unless buyers reclaim the recently lost levels.
📈 Bullish scenario
If buyers defend the current support and push price back above the nearest resistance zone, Gold could begin a corrective recovery before the next directional move develops.
Momentum currently favors the bears, and the current support is the most important level to monitor. A confirmed breakdown would strengthen the bearish outlook, while a strong bullish reaction could trigger a short-term relief rally.
Silver — Bears aren't done yet
❤Silver has broken below the previous support area with strong bearish momentum, confirming that sellers are currently dominating the market. Price is now approaching an important demand zone where the next reaction could determine whether the decline continues or a temporary bounce develops.
📉 Bearish scenario
If sellers manage to break below the current support zone, we can expect the downtrend to continue toward the next major demand area. A confirmed breakdown would reinforce the bearish structure and keep downside pressure intact.
📈 Bullish scenario
If buyers defend the current support and reclaim the recently lost structure, Silver could stage a corrective recovery toward the nearest resistance zone before the broader trend is reassessed.
Momentum clearly favors the bears for now, and the current support is the key level to watch. A decisive breakdown would strengthen the bearish outlook, while a strong reaction from buyers could trigger a short-term rebound.
Apple — Can bulls finish the job?
🏆Apple experienced a strong liquidity sweep below the recent support before buyers quickly stepped back in and pushed price back above the key structure. This recovery shows that demand is still present, but price is now approaching a major resistance zone where the next move will be decided.
📈 Bullish scenario
If buyers break above the current resistance zone, we can expect the uptrend to continue toward new highs. A confirmed breakout would reinforce the long-term bullish structure and keep momentum firmly in favor of the bulls.
📉 Bearish scenario
If price gets rejected from the current resistance and falls back below the reclaimed support, a deeper pullback toward the next demand zones becomes the more likely scenario before buyers attempt another advance.
The recent recovery is an encouraging sign for bulls, but the current resistance remains the key level to watch. A successful breakout would confirm strength, while rejection could trigger another corrective move.
SP500 — Bounce or deeper correction?
🏆The S&P 500 has reacted from an important demand zone after a sharp selloff, with buyers stepping in to slow the bearish momentum. While the bounce is encouraging, price still needs to build strength before the broader bullish trend can resume.
📈 Bullish scenario
If buyers continue defending the current support and reclaim the recent highs, the recovery could extend toward the golden zone. A confirmed breakout above that area would expose the next major resistance zone and strengthen the bullish outlook.
📉 Bearish scenario
If the current demand zone fails to hold, sellers could regain control and push the index toward the next lower support area, confirming that the recent recovery was only a temporary bounce.
The market is sitting at a critical support level where the next reaction will likely determine short-term direction. Holding this demand zone keeps the recovery scenario alive, while a confirmed breakdown would shift momentum back in favor of the bears.
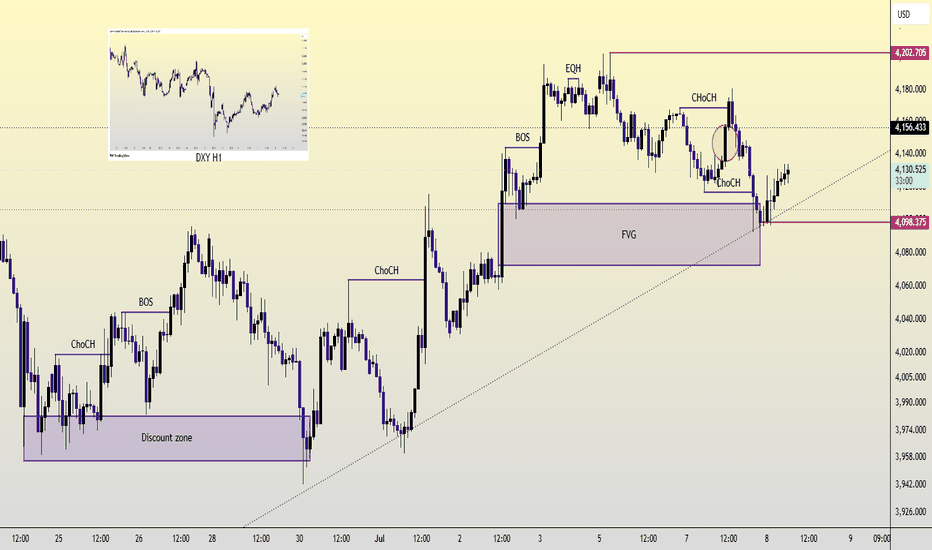
XAUUSD H1: Bullish continuation intact, demand zone 4,098–4,130Pullback, not reversal. Bias stays bullish. Full stop.
Structure's been clean since the discount zone printed at 3,958–3,990. Sequential BOS carried this thing all the way into the EQH, and price didn't hesitate, it swept straight through to 4,202.705. Buy-side liquidity resting above the highs, gone. That leg is finished. Nothing left to chase up there for now.
CHoCH on the H1 is just the pullback tagging itself, not a trend shift. People panic on CHoCH labels like it's a reversal signal. It's not. Price is unwinding into the same FVG that fueled the entire rally off the discount zone. 4,098–4,130. That's the zone. That's the only level that matters right now.
Sell-side liquidity is still sitting under the most recent swing low, 4,130–4,140. Expect that to get run before any real buying shows up. Liquidity gets swept, then price reacts. It's not complicated, it's just sequencing. Anyone expecting a clean bounce without a wick through that low is guessing.
DXY H1 backs this up. Dollar's heavy, correcting lower on its own structure. Inverse correlation is doing exactly what it should. No reason to fight gold here on a dollar strength narrative, because there isn't one on this chart.
Zone: 4,098.375–4,130. Confirmation is a reaction off that zone, not blind entry the second price touches it.
Invalidation is simple, no ambiguity. Clean H1 close below 4,098.375 kills the FVG, breaks the ascending trendline, and this whole continuation idea is off the table. That opens a deeper flush back toward discount.
Target: reclaim and break 4,202.705. Above that, this keeps extending.
Bullish until 4,098.375 closes below. That's the line.
Who's still fading this off the highs.
SILVER SENDS CLEAR BULLISH SIGNALS|LONG
SILVER SIGNAL
Trade Direction: long
Entry Level: 5,883.9
Target Level: 5,986.5
Stop Loss: 5,815.0
RISK PROFILE
Risk level: medium
Suggested risk: 1%
Timeframe: 1h
Disclosure: I am part of Trade Nation's Influencer program and receive a monthly fee for using their TradingView charts in my analysis.
✅LIKE AND COMMENT MY IDEAS✅
SOLUSD: Waiting for the Retest Before Going LongAfter finally breaking the descending trendline, SOL is showing the first signs of a trend reversal. However, I don't like chasing breakouts. More often than not, the market gives you a second chance.
Personally, I'm expecting a pullback into the $76 support zone, which aligns with the breakout area and should act as a key level if buyers remain in control.
That's where I'll be looking to open my long position.
📊 Trade Plan
Entry: $76
Stop Loss: $63
TP1: $95
TP2: $115
TP3: $140
The risk-to-reward here is attractive if price respects the retest. If we lose the $76 level with strong momentum, I'll simply stay out and wait for a better setup. There is no reason to force a trade.
Remember: Professional trading isn't about predicting every move—it's about waiting for high-probability setups and managing risk.
What do you think? Will SOL give us the retest, or is the market ready to continue higher without looking back? 🚀
CAD/CHF BULLS WILL DOMINATE THE MARKET|LONG
Hello, Friends!
CAD/CHF is trending up which is clear from the green colour of the previous weekly candle. However, the price has locally plunged into the oversold territory. Which can be told from its proximity to the BB lower band. Which presents a classical trend following opportunity for a long trade from the support line below towards the supply level of 0.567.
Disclosure: I am part of Trade Nation's Influencer program and receive a monthly fee for using their TradingView charts in my analysis.
✅LIKE AND COMMENT MY IDEAS✅
USDNOK: Wave (4) Correction In Play Before Wave (5) OccursUSDNOK has started a corrective phase after completing an impulsive intraday five-wave decline, which appears to represent wave A of a higher-degree ABC correction within wave (4).
Following the initial sell-off, the pair is expected to enter a corrective recovery phase in wave B. However, once this rebound matures, another decline in wave C could unfold, completing the broader wave (4) correction.
The ideal support area for the next downside move is located around the former wave 4 swing lows, the 38.2% Fibonacci retracement level, and the upper line of the base channel, which currently converges near the 9.66 level.
A successful completion of the wave (4) correction in this support zone would set the stage for the next impulsive advance, with the broader uptrend resuming in wave (5).
AUD/JPY LONG FROM SUPPORT
AUD/JPY SIGNAL
Trade Direction: long
Entry Level: 112.498
Target Level: 112.835
Stop Loss: 112.272
RISK PROFILE
Risk level: medium
Suggested risk: 1%
Timeframe: 1h
Disclosure: I am part of Trade Nation's Influencer program and receive a monthly fee for using their TradingView charts in my analysis.
✅LIKE AND COMMENT MY IDEAS✅
EUR/CHF BEST PLACE TO BUY FROM|LONG
Hello, Friends!
We are targeting the 0.921 level area with our long trade on EUR/CHF which is based on the fact that the pair is oversold on the BB band scale and is also approaching a support line below thus going us a good entry option.
Disclosure: I am part of Trade Nation's Influencer program and receive a monthly fee for using their TradingView charts in my analysis.
✅LIKE AND COMMENT MY IDEAS✅
Aeva Technologies (AEVA) — Powering 4D LiDAR AutonomyAeva Technologies, Inc. NASDAQ:AEVA develops next-generation 4D LiDAR sensors and perception software powered by its proprietary Frequency Modulated Continuous Wave (FMCW) technology, enabling precise measurement of both distance and velocity for advanced autonomous systems.
Key Catalysts:
Commercial production approaching:
Aeva is transitioning toward large-scale commercialization, with its Atlas 4D LiDAR sensors being supplied to Daimler Truck for its autonomous trucking platform targeted for 2027.
Expanding strategic partnerships:
Collaborations with Bendix, NVIDIA, Nikon, SICK, and CityOS demonstrate growing adoption across multiple industries, including autonomous trucking, passenger vehicles, industrial automation, robotics, and smart infrastructure.
Differentiated FMCW technology:
Unlike conventional LiDAR systems, Aeva’s proprietary 4D FMCW technology simultaneously measures distance and velocity, improving object detection, tracking accuracy, and overall perception capabilities.
Exposure to multiple high-growth markets:
Beyond automotive applications, Aeva is positioned to benefit from increasing demand across robotics, industrial automation, intelligent transportation systems, and smart city infrastructure.
Long-term autonomy tailwinds:
Continued investment in autonomous driving, advanced driver assistance systems (ADAS), AI-powered perception, and intelligent infrastructure supports a favorable long-term growth outlook.
Investment Outlook:
Bullish above: $23.00–$24.00
Upside target: $48.00–$50.00
Supported by commercial production milestones, expanding industry partnerships, and differentiated 4D LiDAR technology, Aeva is well positioned to capitalize on the growing autonomous sensing market.
📢 AEVA — Delivering next-generation 4D perception technology for autonomous transportation, robotics, and intelligent infrastructure.
EUR/AUD BULLS WILL DOMINATE THE MARKET|LONG
Hello, Friends!
We are going long on the EUR/AUD with the target of 1.653 level, because the pair is oversold and will soon hit the support line below. We deduced the oversold condition from the price being near to the lower BB band. However, we should use low risk here because the 1W TF is red and gives us a counter-signal.
Disclosure: I am part of Trade Nation's Influencer program and receive a monthly fee for using their TradingView charts in my analysis.
✅LIKE AND COMMENT MY IDEAS✅