KHC — Bullish Bat Harmonic PatternKraft Heinz is approaching a very interesting Bullish Bat harmonic pattern, with the pattern completing near the Potential Reversal Zone (PRZ).
After years of weakness, KHC is reaching an area where this Bat pattern could potentially produce a larger reversal.
Trade Setup
Entry: $23.00–$23.30
Stop Loss: $20.50
TP1: $31.00
TP2: $36.50
TP3: $43.50
TP4: $55.00
The $23.00–$23.30 area is the key zone I'm watching. This is where the Bullish Bat is expected to complete, making it the area where I
Bullish Bat
KSE100 +ve aspects!13-09-2026
> Bullish Bat Pattern (positive sign). However, needs some consolidation.
> Weekly closing above Important Trendline Support (positive sign).
> Immediate Resistance around 176000 - 178700
> Market is safe as long as it stays above 161000.
> Monthly Closing above 166000 - 167000 would be a +ve sign.
SYK: Bullish Bat Pattern With Strong Upside PotentialSYK is showing a bullish Bat pattern on the chart, with price now approaching the Potential Reversal Zone around the $262–$275 area.
This is an interesting setup because the Bat is completing near an important support area. If buyers step in and the pattern holds, SYK could have significant room to the upside.
Trade Setup
Entry Zone: $262–$275
Stop Loss: $249
Take Profit Targets:
TP1: $329
TP2: $355
TP3: $377
TP4: $450+
What I’m Watching
The $262–$275 area is the key reversal zone. This is
BCH/USD: 2 Bullish Structures Pointing Toward the Same ReversalBitcoin Cash is approaching an interesting area on the weekly chart where 2 different technical structures appear to be lining up around the same price level.
The first is a potential Elliott Wave triangle, with the market potentially completing wave (E) near the $112-115 area.
At the same time, there is a potential bullish harmonic pattern completing in essentially the same zone. When two different methods point toward the same area, I think it is worth paying attention.
The $112 -115 Area I
FET/USDT Bullish Setup
FET/USDT is showing **two bullish harmonic patterns** at the same time: a **Bullish Bat** (green) and a **Bullish Butterfly** (yellow).
A **Bullish Bat** is a harmonic pattern that looks for a potential price reversal from a lower support area.
A **Bullish Butterfly** is another harmonic pattern that can signal a possible bullish reversal after a strong decline.
Here, both patterns point to the same area, making the **$0.0777–$0.0900 zone** important to watch.
**Entry:** Look for a bullish
Bullish Points in HUBCHUBC Analysis
Closed at 219.38 (21-07-2026)
Positive Points:
> Bullish Divergence
> Bullish Bat Pattern
Current Range (214 - 219) seems to be a Good Support Zone.
Potential to move upside towards 224 - 226 initially.
It should not break 210.
On a bigger tf, it is also making Bullish Flag Pattern.
AMTX: Bullish Bat Pattern Signals a Potential ReversalAMTX has reached a key Potential Reversal Zone (PRZ) between $1.45 and $1.50, where a Bullish Bat Harmonic Pattern has completed. After an extended decline, this area could mark the beginning of a trend reversal if buyers step in and confirm the move.
Trade Setup
Potential Reversal Zone: $1.45–$1.50
Entry: Wait for a bullish confirmation above $1.50, or consider scaling into a position within the PRZ.
Stop Loss: Below $1.25.
Profit Targets: $2.50, $3.50, $5.00, $10.00, and $14.50.
The setup o
Ethereum's Bullish Bat Pattern Near CompletionEthereum's daily chart is forming a Bullish Bat Harmonic Pattern, with price now trading inside a key Potential Reversal Zone (PRZ). This area represents the completion of the pattern and coincides with a strong historical support level, making it a critical zone to watch for a bullish reversal.
A confirmed breakout from the descending trendline could shift momentum in favor of buyers, opening the door to upside targets at $2,800, $3,850, $5,000, and potentially $7,200 if the pattern fully play
Bullish Patterns Showing Signs of Reversal!BERG Analysis
Closed at 92.32 (18-05-2026)
Bullish Bat Pattern + Bullish Divergence; Both are signs of reversal.
Also ABCD chart pattern touched its Point D (PRZ) in Golden Pocket Range.
So if this time 80 is not broken, we may witness upside towards 97 - 100 &
then around 110 - 111.
Bullish Bat Pattern in PAXGUSDTPAXGUSDT Analysis
CMP 4562.97(19-05-2026 02:59am PST)
Bullish Bat Pattern along with Bullish
Divergence showing signs of reversal.
However, 4488 is an Important Support.
Upside resistance is around 4800 - 4900 initially.
Crossing & Sustaining this range may lead it towards
5200 - 5300.
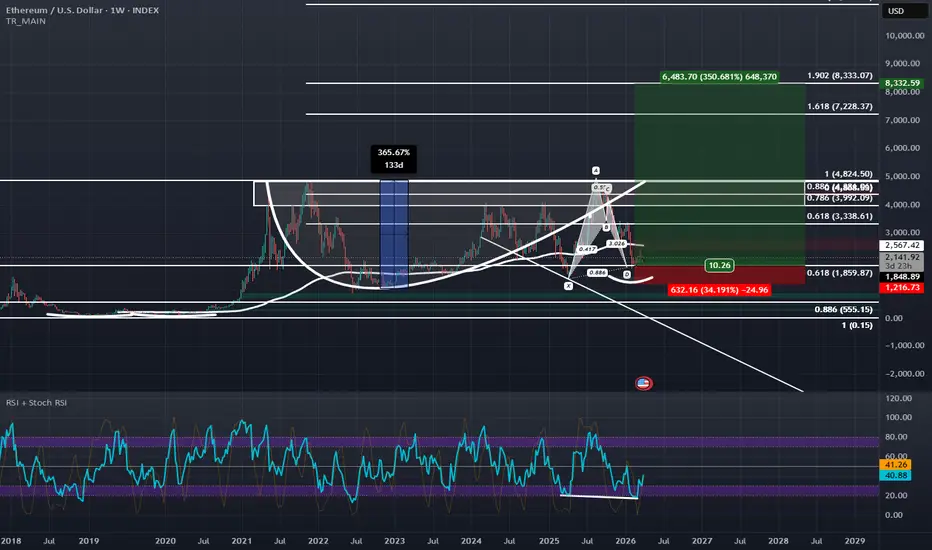
The Bullish Setup on ETH Has More Potential Than Once ThoughtFollowing up on this initial Bullish idea on the 4 Hour:
and this Bullish idea on the daily:
It would seem that ETH also has a big bullish setup on the weekly as seen in the current chart. We are at the all-time 0.618 Retrace and at this retrace we are making a local 0.886 and completing a Bullish Bat visible on the Weekly with Hidden Bullish Divergence on the RSI. If ETH really starts to bounce here at this heavy level of confluence it would be confirming a Partial-Decline of a Right-angle
LAES Bullish Bat with Three Rising Valleys ReversalPattern Identified: Bullish Bat with strong confluence at Potential Reversal Zone (PRZ).
Key Confluence:
Harmonic PRZ: D aligns with 0.886 XA extension
Price Action: Three rising valleys forming at PRZ - showing accumulation and higher low structure
Momentum: Bullish divergence present on MACD
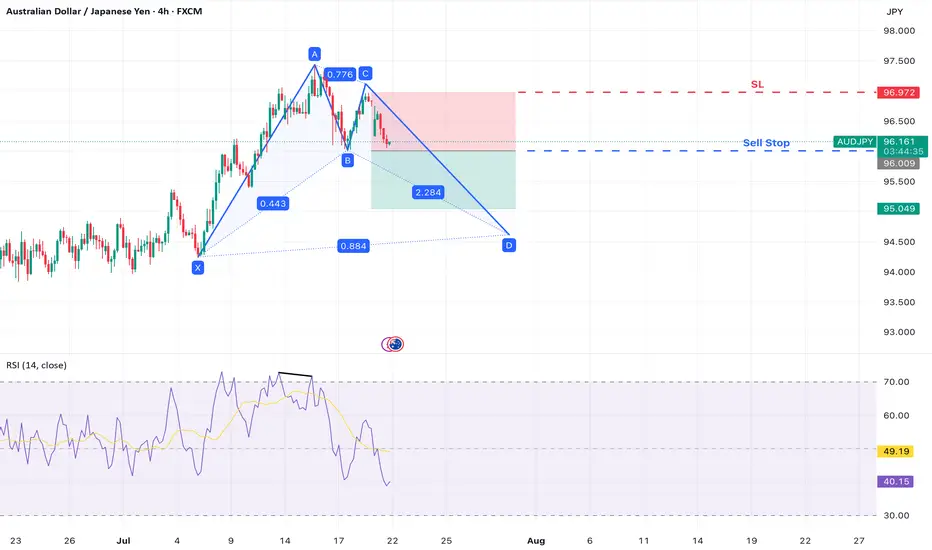
AUD/JPY – Bearish Move Within Bullish Bat StructureAUD/JPY is developing a Bullish Bat harmonic pattern on the 4-hour chart . While the full pattern has not yet completed, a potential short-term bearish opportunity is emerging as the pair begins forming the CD leg.
A clear b earish divergence on the RSI at Point A suggests waning bullish momentum, and a break below Point B may confirm the start of the final leg down toward Point D , completing the harmonic structure.
Trade Setup
Sell Stop Entry: 96.009 (break of Point B – confirms C
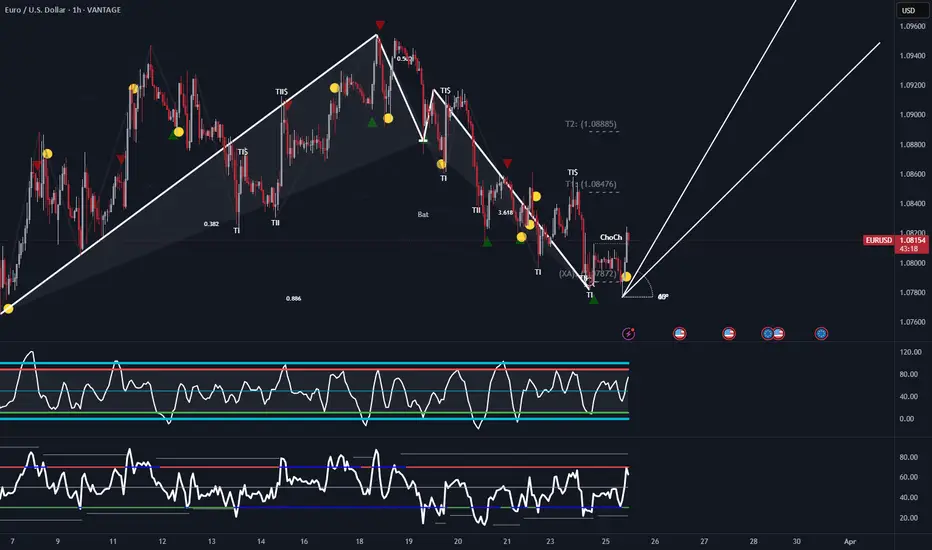
EUR/USD Technical Analysis – Potential Reversal SetupThe EUR/USD 1-hour chart displays a recent downtrend with a series of lower highs and lower lows, forming a bearish market structure. The Harmonic patterns such as the Bat suggest potential areas of reversal, aligning with Fibonacci retracement levels.
A Change of Character (ChoCh) at the latest low (XA 0.7872) signals a possible shift in trend. The presence of bullish reaction points, marked by green triangles and yellow circles, suggests buying pressure is increasing. Additionally, the pr
CAD/JPY: Potential Reversal as Buyers Step InCAD/JPY has shown signs of exhaustion in its bearish momentum after completing a deep Bat harmonic pattern. The pair has reached a key Fibonacci extension zone, where price action suggests a possible reversal.
Bullish interest is evident with price stabilising near the 105.50 level, supported by oversold conditions on momentum indicators. If buyers sustain pressure, a corrective move towards 106.50 and potentially 107.18 could unfold. Confirmation through a breakout of local resistance would fu
Price rengeBAT/USDT Chart:
Trend: Uptrend Price above moving average (yellow line).
Support: Green zone
Around 0.2317.
Resistance: Red zone Around 0.3778.
Possible Strategy:
Buy: Breaked EMA snd firs resistance
Sell: If price fails to break resistance
Note: Always consider market new and overall trends.
100,000$ per coin - BTC heading to 4th HalvingBITSTAMP:BTCUSD BINANCE:BTCUSD CME:BTC1! COINBASE:BTCUSD
What’s Bitcoin?
Bitcoin is a decentralized digital currency that operates on a network of computers, eliminating the need for intermediaries or central authorities. It was introduced in 2009 by an anonymous individual or group known as Satoshi Nakamoto, who outlined the concept in a white paper describing a peer-to-peer electronic cash system. Since then, Bitcoin has emerged as the leading and most valuable cryptocurrency glob
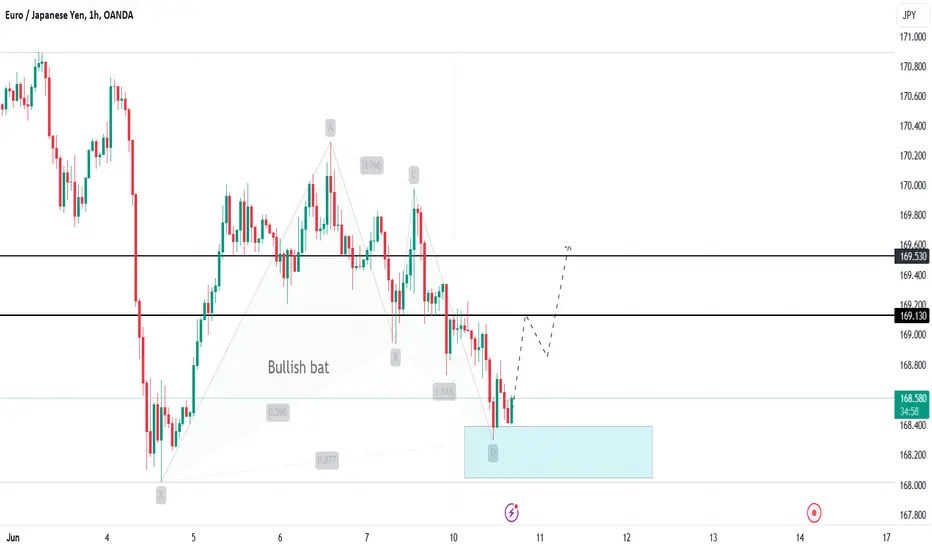
EURJPY Bullish Bat pattern: Forecasting an Upside moveHello traders,
A number of harmonic patterns are surfacing today. Here is my analysis of a clear bullish Bat pattern spotted on the EURJPY Pair. The Bullish Bat pattern is a harmonic pattern used in technical analysis to predict potential reversal zones. The EURJPY pair has formed this pattern with the following parameters:
X = 168.022
A = 170.293
B = 168.940
C = 169.976
D = 168.302
Here's the breakdown of the Fibonacci relationships for this pattern:
AB Leg: Retraces
NVDA may form a bat harmonic within a pennant.NASDAQ:NVDA is potentially forming a bullish bat variation of the Gartley harmonic, within a pennant on the four-hour chart. As long as the earnings low at point B is maintained, there is potential for a reversal to point C next week, corresponding to the upper trendline from all-time highs.