NQ Power Range Report with FIB Ext - 8/26/2026 SessionCME_MINI:NQU2026
- PR High: 29309.75
- PR Low: 29280.00
- NZ Spread: 66.75
Key scheduled economic events:
08:30 | Core PCE Price Index (YoY|MoM)
- GDP
- Durable Goods Orders
10:30 | Crude Oil Inventories
Session Open Stats (As of 1:45 AM)
- Session Open ATR: 503.96
- Volume: 53K
- Open Int: 298K
- Trend Grade: Neutral
- From BA ATH: -5.9% (Rounded)
Key Levels (Rounded - Think of these as ranges)
- Long: 31904
- Mid: 29517
- Short: 27131
Keep in mind this is not speculation or a pred
Bullish Butterfly
FET/USDT Bullish Setup
FET/USDT is showing **two bullish harmonic patterns** at the same time: a **Bullish Bat** (green) and a **Bullish Butterfly** (yellow).
A **Bullish Bat** is a harmonic pattern that looks for a potential price reversal from a lower support area.
A **Bullish Butterfly** is another harmonic pattern that can signal a possible bullish reversal after a strong decline.
Here, both patterns point to the same area, making the **$0.0777–$0.0900 zone** important to watch.
**Entry:** Look for a bullish
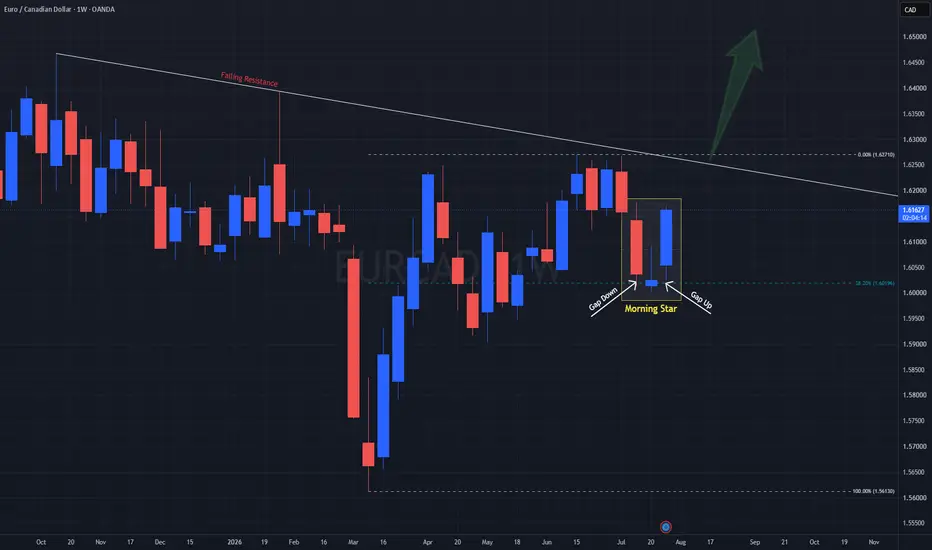
Morning Star Rises On EURCADHere on the Weekly for OANDA:EURCAD , price has formed a strong Bullish reversal pattern called a Morning Star at the 38.2% Retracement Level! This pattern consist of:
1) Large Bearish Candle
2) Small Bullish -or- Doji Candle
3) Large Bullish Candle
There are a couple rules this pattern must follow as well, which are:
- There MUST be a Gap Down from the Close of the First Candle to the Close of the Second Candle.
&
- There MUST be a Gap Up from the Close of the Second Candle to the Open of
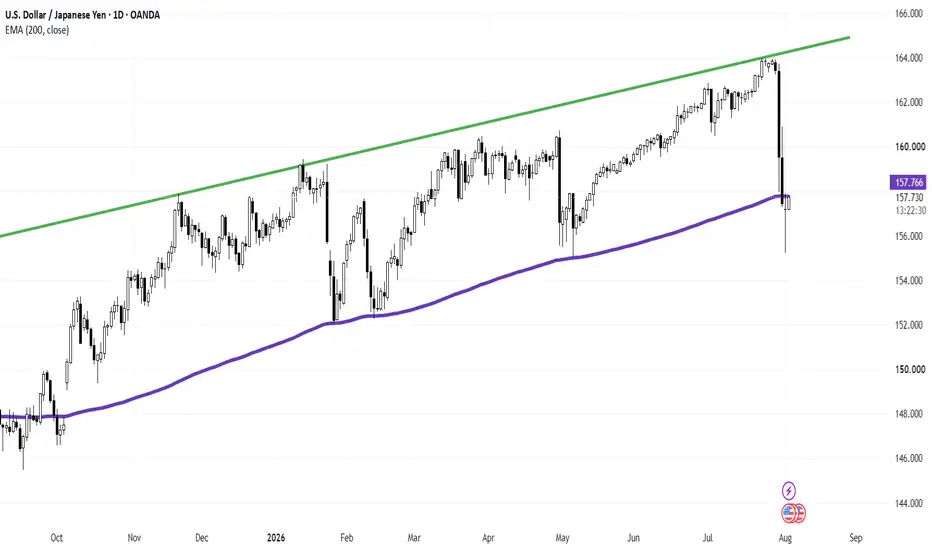
USD/JPY ($USDJPY) Daily: Long-Wick Indecision Candle USD/JPY ( FX:USDJPY ) Daily: Long-Wick Indecision Candle At 200-EMA Highlights Potential Rebound Off 157.76 Support
### 🇺🇸/🇯🇵 U.S. Dollar / Japanese Yen ( FX:USDJPY ) Daily Technical Framework (Ref: USDJPY_2026-08-04_08-32-51.png)
We are releasing a Daily (1D) technical update on FX:USDJPY following a violent multi-day sell-off originating from the channel resistance line (green top baseline near 164.000). The severe downside momentum has collided directly into the major institutional baselin
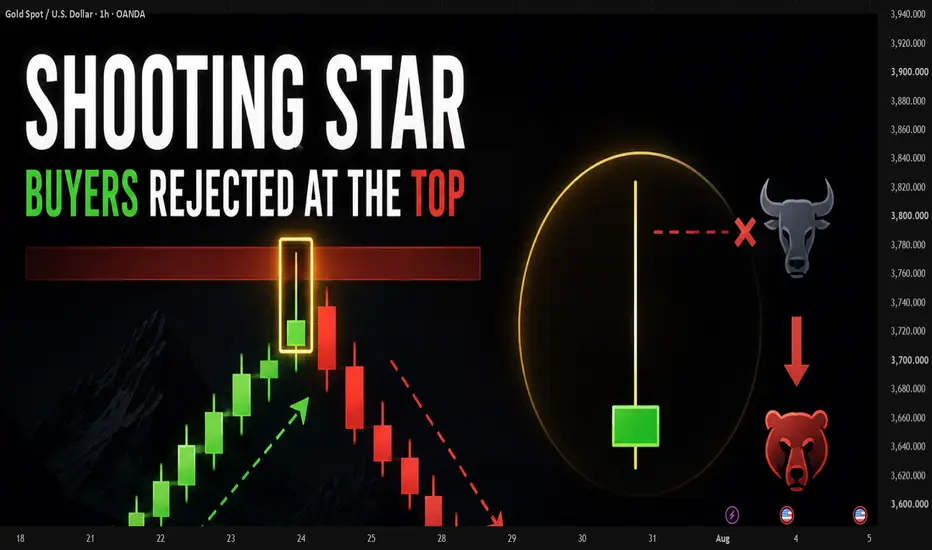
Shooting Star — When Buyers Get Overpowered at the TopShooting Star is a pattern that typically appears at short-term tops or after a rally.
Its defining feature is a small body positioned near the bottom, a long upper wick, and a very short or virtually nonexistent lower wick. The longer the upper wick, the clearer the rejection signal.
The significance of a Shooting Star is that buyers tried to push price higher, but couldn't hold that level. Sellers then fought back and pulled the close down near the low of the candle.
This suggests buying pr
Doji Candlestick — When the Market Starts to HesitateThe Doji candle is one of the most fundamental patterns in Price Action. Its defining feature is that the opening and closing prices are almost identical, resulting in a very small or virtually nonexistent body.
The significance of a Doji isn't whether it's bullish or bearish — it lies in the hesitation it represents.
During that session, buyers tried to push price up, and sellers tried to pull it down, but ultimately neither side truly gained control of the market. Price closing near its open
XAUUSD Algo Map: Bearish Expansion & Decision Core Breakdown💎 XAUUSD Algo Map: Bearish Expansion & Decision Core Breakdown
📋 Report ID: XAUUSD-DAILY-2026-07-24
Asset: Gold Spot (XAU/USD)
Timeframe: Daily (Macro) / 15m (Intraday)
📊 Data Anchor: July 24, 2026 (Daily Close: July 23, 2026)
🔭 Market Context & Price Action
The daily structure for Gold (XAUUSD) has shifted into a dominant bearish expansion phase (Bearish Engulfing Body). Following a brief opening push to a high of 4141.275, institutional supply aggressively flooded the market, driving a massiv
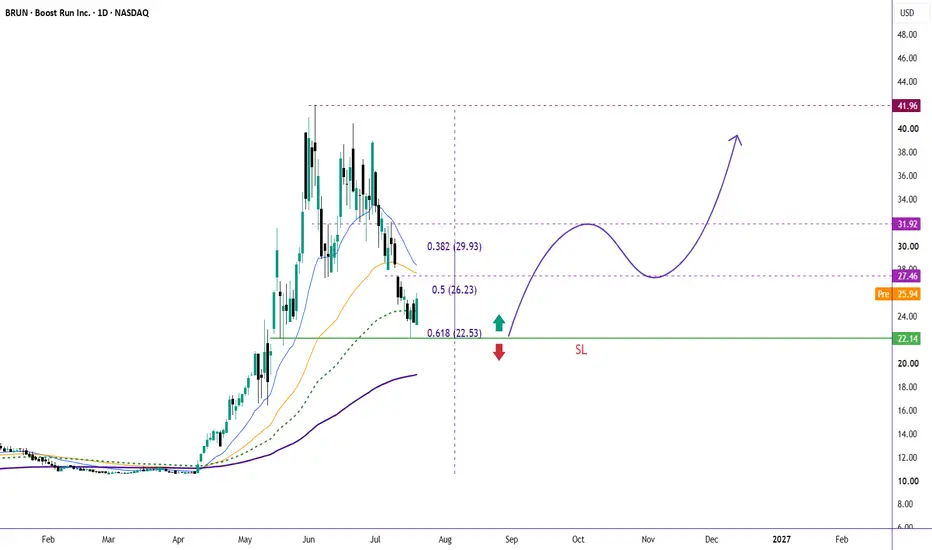
BRUN: Golden Pocket Rebound or More Pain Ahead?Another chart. Another story.
BRUN has delivered an impressive rally from around $10 to a high near $42, rewarding trend followers with a massive move. As expected after such an explosive run, the stock entered a healthy correction phase.
The interesting part? That correction has now reached a high-confluence support zone.
📖 The Story
After the rally, BRUN has retraced into the Fibonacci Golden Pocket (0.5–0.618), with the 0.618 level near $22.5 aligning almost perfectly with horizontal supp
Canadian Dollar Stuck Between Tariffs and OilUSD/CAD traded with a firmer tone on Tuesday as the Canadian Dollar remained under pressure from the latest U.S. tariff escalation. The U.S. imposed a 50% tariff on a range of Canadian goods tied to disputes over cars, alcohol, and dairy, which immediately complicates Canada’s trade outlook. Normally, elevated oil prices would give the Canadian Dollar a cleaner tailwind, but tariff risk and weaker domestic momentum are making that support less powerful.
For the BOC, the rate path remains a ho
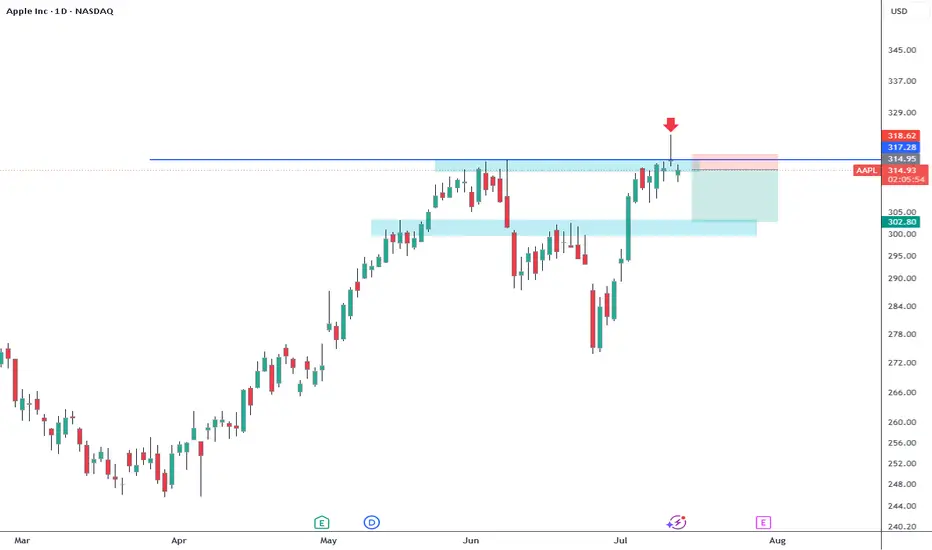
Nasty rejectionApple tried to make ATH yesterday but the price was rejected as shown. Now is trading below the resistance at 317. I don't think that is going to close above that level. I think is going back to the support at 300 before trying ATH again. I bought puts 07/31 300. If the price closes above 317 I'll take the loss.
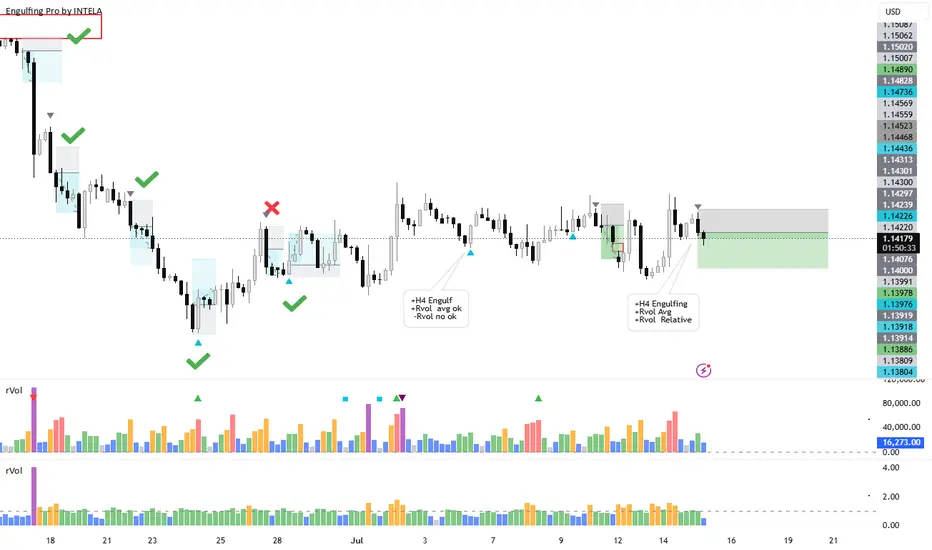
EURUSD H4 Engulfing & Rvol StrategyOne of my strategies involves identifying engulfing patterns on the 4-hour (H4) chart and cross-referencing them with the current context—specifically, analyzing the structure to determine if there is room for the trade to move toward the next level and assessing whether the relative volume is strong.
GBPUSD H4 Engulfing StrategyOne of my strategies involves identifying engulfing patterns on the 4-hour (H4) chart and cross-referencing them with the current context—specifically, analyzing the structure to determine if there is room for the trade to move toward the next level and assessing whether the relative volume is strong.
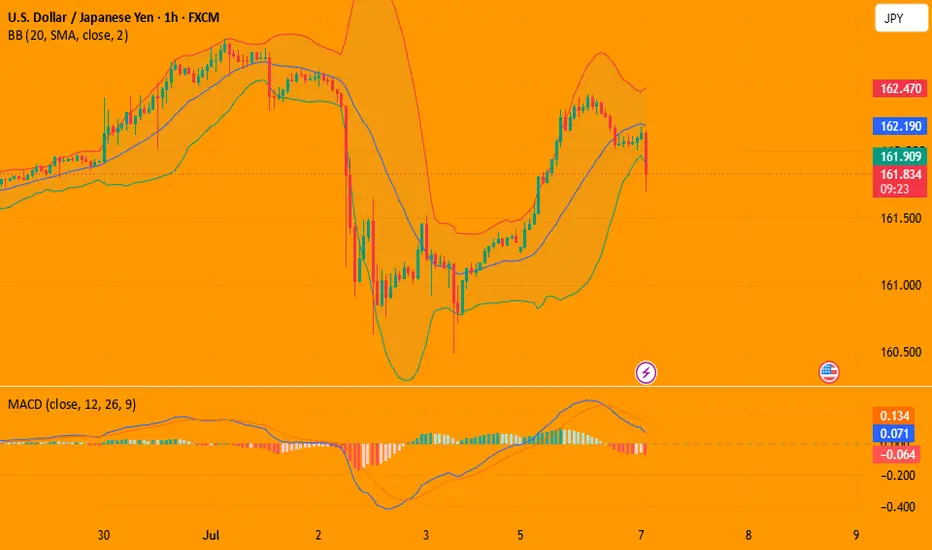
USD/JPY(20260708)Today's AnalysisMarket News:
According to Proactive Research, traders on the forecasting platform Polymarket are generally bullish on gold continuing its rebound in July, but believe that gold prices will not return to the highs reached in January. Bets are concentrated around the month's high of $4,300 per ounce.
Technical Analysis:
Today's Buy/Sell Threshold:
161.96
Support and Resistance Levels:
162.48
162.29
162.16
161.76
161.63
161.44
Trading Strategy:
A break above 162.29 suggests a buy ent
USD/JPY(20260707)Today's AnalysisMarket News:
Saudi Arabia has initiated a price war in the Asian market. With the Strait of Hormuz reopening and global oil supply continuing to increase, Saudi Aramco on Monday lowered its official selling price (OSP) for its flagship crude oil sold to Asia in August by the largest margin in at least 26 years, in an effort to attract Asian buyers.
According to price lists obtained by foreign media, Saudi Aramco lowered its OSP for August Arab Light crude oil by $11 per barrel, representing a
NZD/USD Falls as RBNZ Hike Path Gets MessyNZD/USD fell as much as half of one percent to start the week as the U.S. Dollar regained ground coming out of the holiday weekend. U.S. yields were mixed, but the broader dollar tone improved as markets wait for Wednesday’s Federal Reserve minutes and reassessed how much room the Fed really can ease – or worse yet, have to tighten – while inflation remains sticky. That left the New Zealand Dollar exposed, especially after a rough stretch where global growth concerns, softer commodity sentiment,
NQ Power Range Report with FIB Ext - 7/6/2026 SessionCME_MINI:NQU2026
- PR High: 29979.50
- PR Low: 29860.75
- NZ Spread: 265.75
Key scheduled economic events:
09:45 | S&P Global Services PMI
10:00 | ISM Non-Manufacturing Prices
- ISM Non-Manufacturing PMI
Session Open Stats (As of 12:15 AM)
- Session Open ATR: 746.26
- Volume: 151K
- Open Int: 276K
- Trend Grade: Short
- From BA ATH: -4.5% (Rounded)
Key Levels (Rounded - Think of these as ranges)
- Long: 31904
- Mid: 29517
- Short: 27131
Keep in mind this is not speculation or a predi
GBPUSD with Engulfing by INTELA strategyEngulfing Pro by INTELA + RVOL Context
Overview
Engulfing Pro by INTELA is a price action strategy designed to identify high-probability Engulfing patterns and filter them using Relative Volume (RVOL) analysis. The goal is not simply to trade every engulfing candle, but to distinguish between low-quality signals and those backed by meaningful market participation.
The strategy combines three key concepts:
Engulfing Price Action
Market Structure & Location
Relative Volume Confirmation (RVOL)
By
USD/JPY(20260701)Today's AnalysisMarket News:
Federal Reserve's Hamak: Inflation remains too high, and a rate hike may need to be considered; interest rate futures show the probability of a Fed rate hike in September has risen to 80%.
Technical Analysis:
Today's Buy/Sell Threshold:
162.35
Support and Resistance Levels:
163.16
162.86
162.66
162.03
161.83
161.53
Trading Strategy:
If the price breaks above 162.66, consider buying, with a first target price of 162.86.
If the price breaks below 162.35, consider selling, with
Engulfing Pro by INTELA with RVOL and Support/Resistance Context📈 Backtest: Engulfing Pro by INTELA with RVOL and Support/Resistance Context
This chart illustrates a series of backtested trades taken using the Engulfing Pro by INTELA indicator. The strategy is not based solely on the engulfing pattern itself, but rather on combining the signal with broader market context to improve accuracy and reduce false entries.
🔑 Core Idea
The Engulfing Pro indicator highlights bullish and bearish engulfing candlestick patterns, which are widely recognized as potential