EUR/NZD-Bullish Opportunity with Harmonic Pattern & RSI Div.This report provides a detailed technical analysis of the EUR/NZD currency pair, emphasizing a Bullish Butterfly Harmonic Pattern forming at a key support area. The analysis is supported by a Bullish RSI Divergence observed on the 4-hour chart, reinforcing our bullish bias.
Bullish Butterfly Harmonic Pattern:
The EUR/NZD is currently forming a Bullish Butterfly Harmonic Pattern, a reversal pattern signaling a potential bullish trend. This pattern is characterized by precise Fibonacci retracem
Butterfly
EUR/GBP: Bullish Butterfly Pattern with ConfluenceEUR/GBP is currently exhibiting a bullish technical setup based on a harmonic pattern and RSI divergence, suggesting a potential upside move.
Harmonic Pattern Setup:
A bullish butterfly pattern is forming on the EUR/GBP chart.
Point D of the pattern, also known as the Potential Reversal Zone (PRZ), is nearing a key support area. This confluence strengthens the bullish case for a reversal at this level.
Bullish RSI Divergence:
Bullish RSI divergence is observed on both the 1-hour and 4-hour
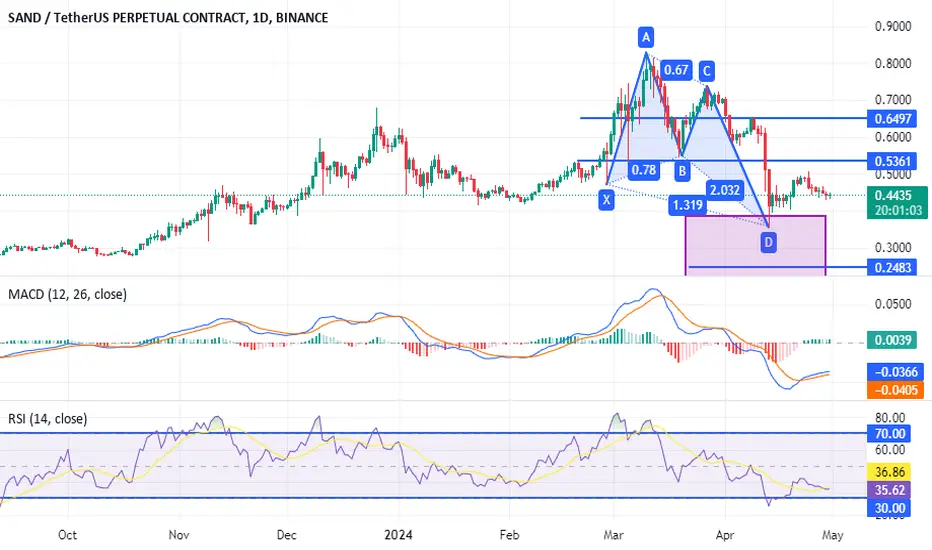
XMRUSDT: Bullish Butterfly Update: Bullish Breakout Seems LikelyXMR, despite the spot pairing having been delisted on Binance a few months ago, has survived and held above the PCZ that was of very much importance to the historic price action. During the delisting XMR had sold off back down to the PCZ in record volumes on the exchange, however, in spite of record selling the support still held, since then, the price has stagnated at this level potentially hinting towards accumulation. If the Support had Broken XMR likely would have crashed all the way back do
AUDUSD Bearish Butterfly Pattern Signals ReversalThe AUDUSD pair is currently forming a Bearish Butterfly Harmonic Pattern (XABCD), a classical harmonic formation that signals potential trend reversals. The critical Point D, known as the Potential Reversal Zone (PRZ), is where the pattern completes, indicating a high probability of a bearish reversal.
Confluence Factors:
Key Resistance Area: Point D aligns precisely with a significant resistance level, suggesting strong selling pressure at this zone.
4-Hour Trend Line: The PRZ also co
The reduction target is 16,500According to the Butterfly pattern, the Fibo perfectly converges the decline at the target of 16500. We also go down the channel where the lower border of the channel will be. All 3 parameters should be added together. We should reach it by October, there will be a great point for going to long.
NZDUSD Bearish Momentum Expected from Anti-Butterfly PatternHarmonic Pattern Formation: Anti-Butterfly (XABCD)
NZDUSD is currently forming an Anti-Butterfly Harmonic Pattern on the 4-hour time frame.
The pattern consists of four distinct legs: X, A, B, and C, with Point D indicating a potential reversal area.
Confluence with Trendline and Fibonacci Level:
The Anti-Butterfly pattern is accompanied by a trendline, adding confluence to the potential reversal zone.
Price has exhibited a strong rejection at a key resistance level and the 0.618
EURUSD Bearish Butterfly Pattern Formation @ 4-Hour TimeframeEURUSD is currently forming a Butterfly Harmonic Pattern (XABCD) on the 4-hour timeframe. This pattern is characterized by specific Fibonacci ratios between the price swings. The pattern consists of four legs: XA, AB, BC, and CD. The completion point, known as Point D, is expected to coincide with a key Resistance level.
Trendline Analysis:
Additionally, there is a trendline that intersects with the completion point of the Butterfly pattern. This trendline further reinforces the potential res
SHIBUSD Shiba Inu Unlocking Profit PotentialButterfly Harmonic Pattern Formation:
SHIBUSD is currently displaying a formation of a Butterfly Harmonic Pattern, indicating potential bullish momentum in the near future. This pattern is characterized by distinct Fibonacci levels and specific geometric shapes.
Trendline Confirmation:
The pattern is further validated by the presence of a trendline, adding confluence to the bullish bias. The intersection of the trendline with the Butterfly Harmonic Pattern enhances the significance of the po
GILT about to reversal!It seems it is a time for reversal of $NASDAQ:GILT.
A nearly prefect bullish butterflies harmonic patter is observed at 5.28$.
The stochastic is in oversold region.
NASDAQ:GILT already tested this resistance 3 times from October 2022.
My stop loss will be at around 5.12.
First price target around 6.20 at 200 MA which is on Fib 0.5 and second price target at around 6,70.
Good luck to all
GBP/CAD Harmonic Pattern Signals Bearish OpportunityOverview:
GBP/CAD has recently exhibited the formation of an Anti-Butterfly XABCD harmonic pattern, concomitant with the price approaching a crucial Resistance area. This confluence suggests a potential Bearish reversal from point D, indicating a favorable opportunity for traders to capitalize on the impending downward movement.
Entry Strategy:
A prudent entry point for this trade is near 1.72840. This level aligns with the anticipated reversal point, providing an optimal entry opportunity f
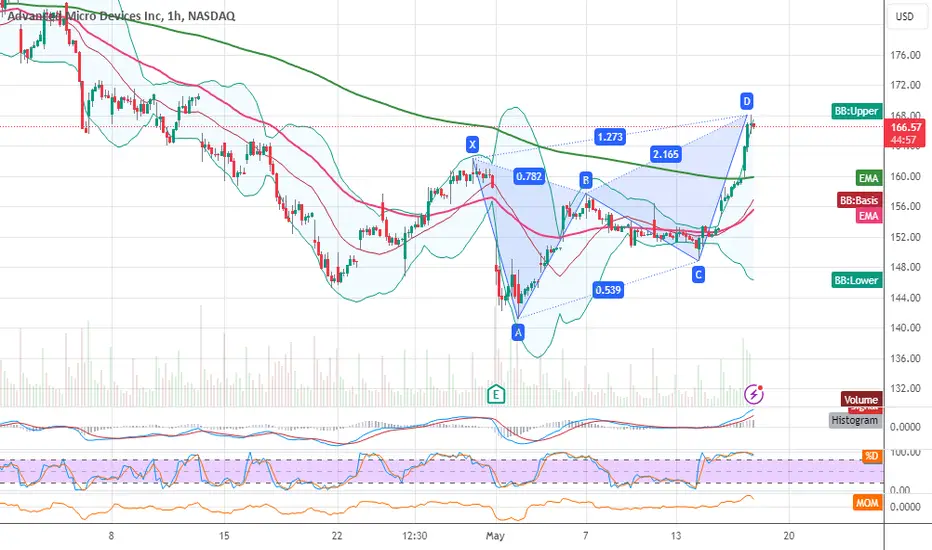
📈 Bullish Butterfly spotted on NASDAQ! 🦋 Bulls set to dominateExciting news for traders as a bullish Butterfly pattern emerges on NASDAQ 📊🔍. This pattern, known for its predictive power in forecasting bullish reversals 📈, suggests a potential uptrend in the market.
The Butterfly pattern consists of specific Fibonacci ratios between price swings, indicating a strong probability of a bullish reversal. Traders are anticipating a surge in buying pressure as the pattern unfolds 📈💪.
Key to this pattern are four distinctive points: the initial downward leg, a c
GBPNZD Anticipating Bearish Momentum with Harmonic PatternGBPNZD is exhibiting a potential Anti-Butterfly Harmonic Pattern (XABCD) formation, indicating a forthcoming bearish trend momentum. This analysis is based on key resistance levels and Fibonacci retracement levels, suggesting a strategic entry opportunity.
Pattern Identification:
The Anti-Butterfly Harmonic Pattern (XABCD) is emerging on the GBPNZD chart, with Point D coinciding with a critical resistance level and the 0.618 Fibonacci retracement level. This convergence enhances the significa
AUDCHF - Capture Bullish Opportunity with Anti-Butterfly PatternTrend Analysis:
AUDCHF is currently exhibiting a Bullish trendline on the 4-hour time frame, indicating a favorable upward trajectory in the market sentiment. Additionally, the currency pair adheres to Dow Theory principles, further reinforcing the bullish bias.
Fibonacci Retracement:
A retracement to the 0.786 Fibonacci level has been observed, signaling a temporary pullback within the overarching bullish trend. This retracement was met with upward rejection, indicating robust buying pressu
CAD/CHF - Bullish Reversal Potential following Anti-ButterflyIntroduction:
CAD/CHF has recently formed an Anti-Butterfly XABCD harmonic pattern, indicating a potential bullish reversal. This technical analysis aims to provide insights into potential entry and exit points for traders interested in capitalizing on this pattern.
Pattern Formation:
The Anti-Butterfly XABCD pattern on CAD/CHF suggests a reversal in the prevailing downtrend. This pattern typically consists of four distinct price swings, labeled X, A, B, and C, followed by a potential revers
Liquity (LQTY) completed a setup for upto 27% pumpHi dear friends, hope you are well and welcome to the new trade setup of Liquity (LQTY) with US Dollar pair.
Recently we caught almost 13% pump of LQTY as below:
Now on a 4-hr time frame, LQTY has formed a bullish Butterfly move for the next price reversal move.
Note: Above idea is for educational purpose only. It is advised to diversify and strictly follow the stop loss, and don't get stuck with trade.
XAUUSD (Golod) Update....
AronnoFX will not accept any liability for loss or damage as a result of
reliance on the information contained within this channel including
data, quotes, charts and buy/sell signals.
If you like this idea, do not forget to support with a like and follow.
Traders, if you like this idea or have your own opinion about it,
write in the comments. I will be glad.
GBPUSD Update: Potential Bearish Flag Trading Setup IdentifiedTrade Setup:
- Entry: Sell at retest of trendline
- Target: Extended towards Bullish Butterfly Pattern completion zone
- Trade Management: Utilizing upsize trade strategy
Analysis:
While many analysts see consolidation, I've identified a potential Bearish Flag trading setup on GBPUSD. The series of lower highs on the 4-hourly chart indicates a possible continuation of the bearish trend. I'm waiting for a retest on the trendline to execute a short position on GBPUSD. Using my trade manageme