Give me 3 reasons not to be bullish on SolanaSolana’s Total Value Locked (TVL) expanded from $396M on Dec 26, 2022 to $8.69B by July 4, 2025, a 2,094% increase (~22x growth) across 80 weeks . This translates to a weekly geometric growth multiplier of ~1.089, or an 8.9% compound weekly rate .
This rapid TVL expansion reflects capital inflows, increased DeFi participation, and regained trust in Solana’s infrastructure following the FTX collapse.
————————————————
LST Ecosystem Expansion :
Liquid staking derivatives (JitoSOL, mSOL) accounted for a significant share of inflows, as yield-seeking capital returned with Ethereum-style primitives on Solana.
MEV Monetization & Compression Tech :
Validator-side MEV solutions and data compression (via Firedancer and ZK-state) improved scalability and trust in Solana’s low-latency environment.
Resurgence of DeFi-NFT Hybrids :
Protocols like Tensor and HadeSwap blurred lines between DeFi and NFTs, generating sticky liquidity and reinforcing Solana’s unique narrative.
Restored Institutional Confidence :
Post-FTX reforms and a more diversified validator ecosystem helped re-attract institutional capital, supported by enhanced wallet infra (e.g., Backpack, Phantom) and custodianship.
This pattern, paired with the geometric growth trend, suggests Solana’s DeFi ecosystem is entering a new structural bull phase, underpinned by both technical confirmation and fundamental evolution.
Anyways, let me know in the comments 3 reasons not to be bullish on Solana as we speak.
(PS: QC-resistant issues don’t apply only for Solana but for all major crypto assets!)
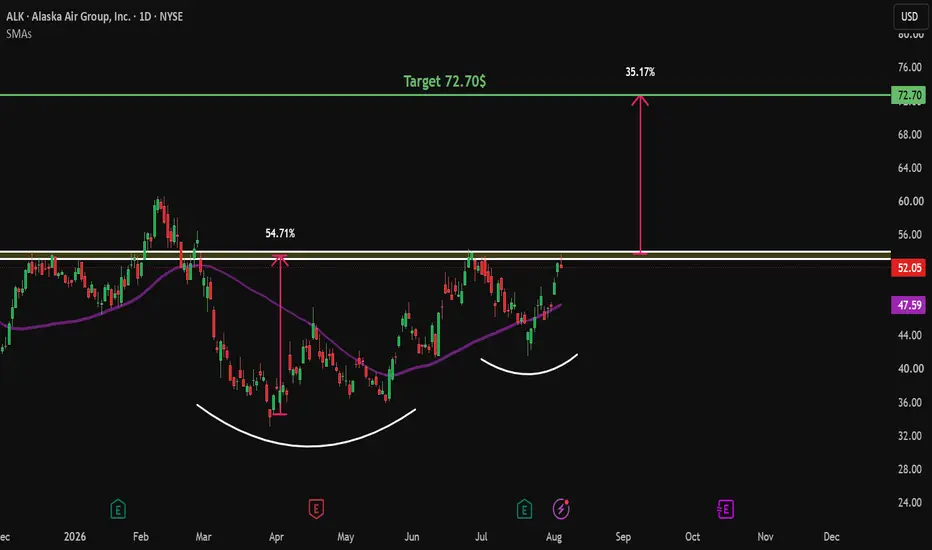
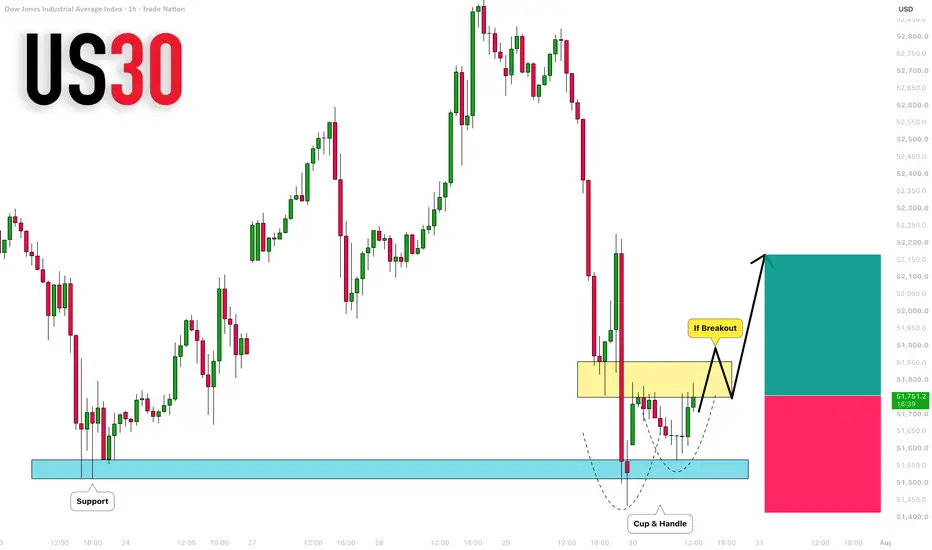
Cup And Handle
$RGTI - Rounding Bottom and 50 SMA Breakout💡 Swing setup idea
Bullish breakout
🔎 Analysis summary:
The stock formed a rounding bottom and broke back above the 50 SMA.
Above-average volume is coming in, showing strong buying pressure behind the move.
👀 Levels to watch:
Entry trigger: Close above $27.41
Target: $41.81
Stop: Under the breakout level
Good luck!
KWALITY WALLSKwality Walls (India) Ltd. (CMP ₹29.60, NSE: KWIL)
Prepared by Sucrit Patil | The SmartWay Research Desk | 3 June 2026
A frozen desserts and FMCG company, originally part of Hindustan Unilever Ltd., now majority owned by The Magnum Ice Cream Company N.V. (Netherlands) after its 2025 acquisition. Kwality Walls operates across India, South Asia, and Southeast Asia, with a strong brand presence in frozen desserts and ice creams.
Promoter Holding (Mar 2026): Magnum Ice Cream Company — 61.90% stake (no pledges)
FY22–FY26 Snapshot
Revenue Growth: FY25 revenue ₹6,954 Cr vs ₹6,215 Cr in FY24 (+11.9% YoY) → Good
Net Profit: FY25 PAT ₹182 Cr vs ₹156 Cr in FY24 (+16.7% YoY) → Good
Operating Margin: FY25 EBITDA ₹312 Cr, margin 14.1% vs 13.2% last year (+90 bps) → Good
Equity Capital: Stable, face value ₹1 → Good
Dividend Policy: No dividend declared; reinvestment focus → Neutral/Weak
Asset Building: Expansion into South Asia and ASEAN frozen dessert markets → Good
Sales: Strong demand from urban retail and quick-commerce platforms → Good
Expense: Raw material cost pressures (milk, sugar) remain → Neutral
EPS: FY25 EPS -₹3.14 (loss-making year) → Weak
Institutional Interest & Ownership Trends (Mar 2026)
Promoter Holding: 61.90% (no pledges)
FII Holding: 0.45%
DII Holding: 0.05%
Retail & Others: 37.60%
Strategic Moves & Innovations
Expansion into premium frozen desserts and plant-based ice creams.
Strengthening distribution through e-commerce and quick-commerce platforms.
Focus on ASEAN regional growth (Thailand, Singapore, Malaysia).
Partnerships with local dairy suppliers for cost optimization.
Cash Flow & Balance Sheet Strength
Market Cap: ~₹6,954 Cr
Debt: Debt-free balance sheet
Book Value Per Share: ₹0.23
P/B Ratio: ~128.7x
EPS (TTM): -₹3.14
P/E: Not meaningful due to losses
Risk Factors
Loss-making despite revenue growth.
Extremely high P/B valuation.
Dependence on discretionary consumer spending.
Competition from established players in ice cream and frozen desserts.
Raw material cost volatility impacting margins.
Investor Takeaway
Kwality Walls is a well-known consumer brand with strong market presence and expansion plans across Asia. Revenue growth remains healthy, supported by premium products and modern distribution channels. However, profitability remains a key concern, with the company still reporting negative EPS and trading at very rich asset-based valuations.
The investment case currently hinges on a successful profitability turnaround rather than earnings strength. Investors should closely monitor margin improvement, operating leverage, and the company's ability to convert revenue growth into sustainable profits before assigning premium valuations.
$FOXA - Cup and Handle Breakout over 50 SMASwing setup idea
Cup and handle breakout
Analysis summary:
The stock just crossed back above the 50 SMA and is setting up a potential cup and handle pattern.
Buyer volume is stepping in as we look for the breakout to trigger.
Levels to watch:
Entry trigger: Close above $66.81
Target: $80.36
Stop: Below support
Good luck!
CRWV Ready to Jump 90%+?? Cup & Handle Chart PatternNASDAQ:CRWV is currently in the handle phase of a cup & handle chart pattern. Feel free to google the specifics around this chart pattern, but this is my take of where we are at on the chart (daily). If this hits a breakout, we have a potential run up to $200+ with the typical C&H target.
Also shown is NASDAQ:LUNR with a recent completed C&H to help understand the pattern in full, and you can look at NASDAQ:RKLB as well for a similar pattern. You'll see these everywhere once you start looking for them, and they work on any time frame!
$FLY BUY NOW AGAIN BEFORE ITS TOO LATEFireFly is a high-growth rocket play that's still flying under the radar compared to its bigger rival Rocket Lab ( NASDAQ:RKLB ).
While RKLB sits at a massive ~$60B+ market cap with stronger current margins, FLY trades at a much more attractive valuation multiple on sales with explosive upside potential as it scales launches and defense/lunar contracts.
Key Fundamentals (mid-2026):
Market Cap: ~$7-8B (vs RKLB ~$61B)
Revenue (TTM): ~$185M, growing rapidly (Q1 2026 alone hit $81M — up big sequentially)
2026 Guidance: $420M – $450M revenue (huge step up)
Backlog: $1.3B – $1.4B and growing (80% of 2026 guidance already secured)
P/S Ratio: Significantly lower than RKLB — better entry point for the growth story
Profit Margins: Still negative (like most space names), but gross margins improving and government contracts provide visibility
Why FireFly is Primed to Run:
Multiple NASA wins including $75M MoonFall subcontract for lunar drones and Blue Ghost lunar lander missions.
Selected for Golden Dome space-based missile defense program (huge national security tailwind).
Successful Alpha Flight 7 launch + Block II upgrades coming.
Expanding production campus and scaling toward higher launch cadence with Eclipse medium-lift vehicle.
Strong cash position and government-backed revenue runway.
FireFly ( NASDAQ:FLY ) vs Rocket Lab ( NASDAQ:RKLB ) Fundamentals:
Market Cap: FLY ~$7.9B – $9.2B | RKLB ~$82B – $87B
Shares Outstanding: FLY ~160M | RKLB ~579M
Revenue (TTM): FLY ~$185M | RKLB ~$680M
2026 Revenue Guidance: FLY $420M – $450M (very strong growth expected) | RKLB continuing solid growth
Backlog: FLY ~$1.3B – $1.4B (80% of 2026 guidance already secured) | RKLB ~$2.2B
Gross Margin: FLY ~22% | RKLB ~36–38% (stronger)
Net Profit Margin: FLY ~-194% | RKLB ~-27% (much narrower losses)
P/S Ratio (TTM): FLY ~33x – 42x | RKLB ~120x+
Valuation Edge: FLY trades at a much cheaper multiple on sales → better risk/reward for growth
This isn't just another micro-cap pump — it's a real aerospace company executing on contracts in a sector where the U.S. is heavily investing (lunar economy + defense).
Loading up for the next leg higher. Target $70–$80+. IF YOU WANT 2X+ GAINS GET FLYT LEVERAGED SHARES, THIS WILL ABSOLUTELY FLY TO THE MOON, ONCE IN A LIFETIME OPPORTUNITY, WE ARE THE BIGGEST BULL RUN IN US HISTORY!!
Shivalik Rasayan | Early Breakout CatchBias: Bullish (Breakout Attempt — Awaiting Confirmation)
Shivalik Rasayan is attempting a breakout from a prolonged descending channel on the daily timeframe. Today's candle is testing a key confluence zone — horizontal resistance (~₹292.75) and a descending trendline from Aug 2024 highs, both being challenged simultaneously.
What makes this worth watching right now is the volume — today's breakout attempt is accompanied by one of the largest volume spikes in recent months, suggesting strong participation at this level.
Setup Details:
• Downtrend: Extended decline from ~₹475 to ~₹225 over nearly a year
• Breakout Zone: ~₹292.75 (horizontal resistance + descending trendline confluence)
• Volume: Excellent — multi-month high on the breakout attempt
• Stochastic: Rising strongly from oversold, confirming momentum shift
This is an early breakout catch — price has not yet closed above the breakout zone. A confirmed daily close above ₹292.75 is required to validate the setup.
Trade Parameters (on confirmed close above ₹292.75):
• Entry: Daily close above ₹292.75
• Target 1: ₹339
• Target 2: ₹382.80
• Stop Loss: ₹245.80 (swing low support)
• Trade Duration: 6 – 10 weeks
Invalidation:
Daily close below ₹245.80 invalidates the setup.
For educational purposes only. Not financial advice.
#ShivalikRasayan #SHIVALIK #NSE #TrendlineBreakout #TechnicalAnalysis #SwingTrading #IndianStockMarket #Education #TradingView
TSLA: Bullish Cup & Handle Breakout Targets Unfilled Gap 475📊 OverviewTesla ( NASDAQ:TSLA ) is showing an incredibly clean, bullish structure on the daily/weekly timeframe. We are observing a classic Cup and Handle macro pattern that is nearing confirmation. This setup is beautifully supported by historical trendline behavior and clear structural magnets overhead. 🔑 Key Technical DriversThe 20% Bounce Rule (Lower Trendline Support): Historically, every time TSLA has retested this primary ascending lower trendline, it has triggered an immediate, high-probability bounce of approximately 20%. The recent defense of this level confirms that buyers remain extremely aggressive at trendline support.Cup and Handle Geometry: The chart has formed a massive rounding bottom (the Cup) followed by a shallow, constructive consolidation period (the Handle). A decisive breakout above the handle's resistance line triggers the macro pattern. The Target Magnet (Bear Gap at $475): There is a major, unfilled daily bear gap sitting right around $475. Gaps act like price magnets, and a successful breakout from this handle gives the bulls exactly the momentum needed to fill it.📐 The Measured MoveTaking the technical depth of the Cup and projecting it upward from the breakout zone gives us a primary target right at $475, aligning perfectly with the gap-fill area.🎯 Target 1: $455 (Local Resistance / Handle Highs)🎯 Target 2 (Main Target): $475 (Measured Move & Bear Gap Fill)🛑 Invalidations/Stop Loss: A daily close back below the lower trendline or handle support invalidates the immediate bullish thesis.💡 Execution StrategyConservative Entry: Wait for a confirmed daily close above the handle resistance line to confirm the breakout momentum. Aggressive Entry: Scale in closer to the lower trendline support, risking off the recent local low.What do you think? Let me know if the trendline holds!Disclaimer: This is for educational purposes only and does not constitute financial advice.
GOLD (XAUUSD): Another Gap Setup
I think that Gold will try to at least partially fill the gap up opening.
A formation of an inverted cup & handle after a test of a strong intraday
resistance suggests a strong selling pressure.
Expect a retracement to 4537.
❤️Please, support my work with like, thank you!❤️
I am part of Trade Nation's Influencer program and receive a monthly fee for using their TradingView charts in my analysis.
Apollo Micro Systems Ltd Trading IdeaStock has shown strong upward momentum as you ca see chart show a rounding bottom pattern wiht open marabuzu gap up candle wiht good volume and RSI it can re trade till it Fib Levels which is 373, 358 after that it can go furthermore.
Technical Analysis & Indicators
Weekly TF
Rounding Bottom Breakout
Marabuzu
Support: ₹358–₹378 zone
Cup and Handle: NVIDIA ($NVDA) vs the MAGS ETFNVDA & MAGS Market Context (February 2026)
The technical setup is forming against a backdrop of significant volatility and anticipation:
NVIDIA (NVDA): As the "AI bellwether," NVDA reports earnings on Wednesday, February 25, 2026. While it has been the sole Mag7 stock clinging to gains in early 2026 (+0.8% YTD), analysts have noted a dominant near-term downtrend that the Cup and Handle would need to overcome.
MAGS ETF: The ETF has faced a "brutal February," dropping 6.7% as investors rotated away from Big Tech. It is currently testing its 200-day moving average ($61.03); staying above this level is critical for any bullish pattern to hold.
This Cup and Handle breakout suggests NVIDA could "blow" the doors off this earnings call.
ETHUSD - Bulls Loading Up Just Below BreakoutETH on the 4H chart is forming a cup and handle pattern. The rounded bottom came after the drop into the 1,937 area, and from there, the Crypto has been slowly climbing back up. That kind of recovery usually shows steady buying rather than a quick bounce. Now, ETH is pulling back slightly, which is the handle part. This pullback looks controlled, not aggressive, so it feels more like a pause than any real weakness.
At the moment, price is just moving in a tight range and drifting a bit lower. Sellers are not really pushing hard, and buyers are not chasing yet either. This kind of behavior usually happens before a bigger move, where the market builds up energy. The overall structure still looks clean, so nothing is broken for now.
The key level to watch is 2,405 . This is where price has been rejected before and where the breakout needs to happen. If ETH pushes above that level and manages to stay there, that confirms the pattern and opens the move toward 2,850 . That target comes from the size of the cup projected upward. Until ETHUSD actually breaks that level, it is still just a setup forming, so it makes more sense to wait and react instead of guessing early.
We will update further information soon.
CRUDE OIL (WTI): FVG Trade
I think that a bearish FVG will be filled soon on WTI Crude Oil.
A formation of a cup & handle pattern on a strong intraday support
and a bullish violation of its horizontal neckline suggest a strong
buying interest.
Goal - 99.736
❤️Please, support my work with like, thank you!❤️
CRUDE OIL (WTI): Bullish Move From Support
WTI Crude Oil will likely pull back from a strong intraday horizontal support.
The price formed a cup & handle pattern on that and violated its neckline
with London session opening, indicating a strong buying interest.
Goal will be 105.467
❤️Please, support my work with like, thank you!❤️
GNFC..Rains come...Fertilizer goes upRains are almost here..So fertilizer will go up..Also this stock has broken out into a new price range....Kind of a cup and handle pattern breakout..the tgt calculated is mentioned on the chart...for traders the stoploss is mentioned..for investors ..no stoploss..choice is yours...But this one is a good call..for a buy..
Robo double bottom/cup and handleRobo has formed a double bottom and the closest “bottom” is also a cup and handle. Dual indicators on chart is a beautiful thing. This is the daily chart so it may take time to play out if you’re used to scalping like me I tend to ruin good trades when nothing happens just for it to spring to the target after exiting my position.