ETF SPY weekly (log)Hello everyone,
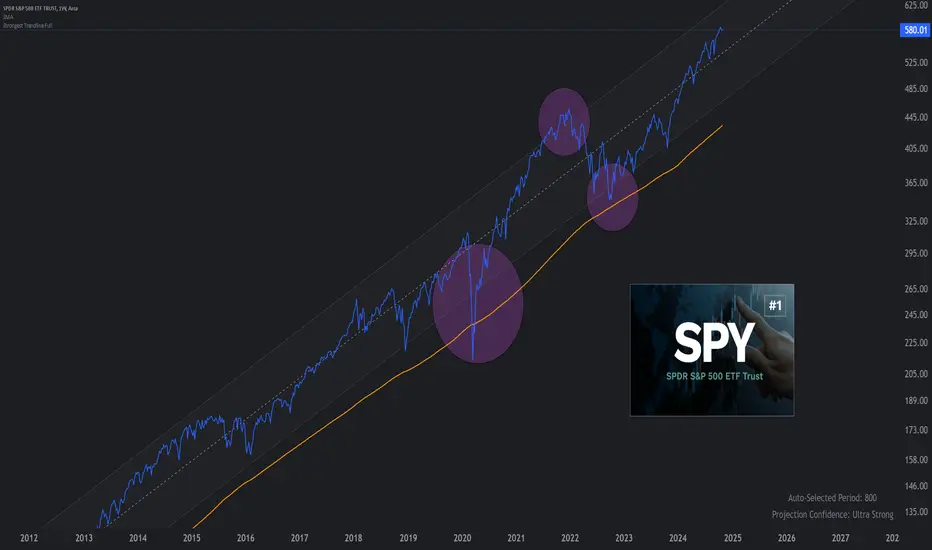
Weekly chart in logarithmic scale.
The channel is bullish, we are in the upper part of the channel, but I do not see any bullish exaggeration.
The 200-period simple average is bullish in orange on the screen.
In any case, investing in the SPY is a very good investment.
Make your own opinion, before placing an order.
► Thank you for boosting, commenting, subscribing!
ETF
SPY Pullback: Time to Consider New Swing Long Positions!While AMEX:SPY remains in a strong uptrend, today’s 0.5% decline offers a healthy retracement for swing traders looking to enter long positions at more favorable levels. I don’t expect this pullback to last long or be of significant magnitude, but the short-term weakness is evident, creating an attractive window to buy into the trend. Watch for upcoming signals, as this dip could present a fresh opportunity for the next upward move.
The technicals support this outlook:
Relative Strength
Bitcoin - American elections, future fluctuations of Bitcoin!Bitcoin is above the EMA50 and EMA200 in the 4H time frame and is trading in its ascending channel
Risk ON sentiment in the US stock market or investing in Bitcoin ETF funds will lead to its continued upward movement
Capital withdrawals from Bitcoin ETFs or risk OFF sentiment in the US stock market will pave the way down for Bitcoin, which can be used to look for Bitcoin buying positions in the two specified demand zones
As long as Bitcoin is within the specified range, you can look for buy and
Bitcoin - The return of Trump, the rise of Bitcoin?!Bitcoin is above the EMA50 and EMA200 in the 4H timeframe and is trading in its ascending channel
Risk ON sentiment in the US stock market or investing in Bitcoin ETF funds will lead to its continued upward movement
Capital withdrawal from Bitcoin ETFs or Risk Off Sentiment in the US stock market will pave the way down for Bitcoin, which can be found in the two defined demand zones, looking for Bitcoin buying positions
It should be noted that there is a possibility of heavy fluctuations and shad
Mt. Gox Delays Repayment Deadline, Bitcoin RalliesMarket Update - October 18, 2024
Mt. Gox has delayed its bitcoin repayment deadline by a year: This delay is viewed as a greenshoot for bitcoin prices, with traders arguing it reduces selling pressure on the broader market. The price of bitcoin was just short of $67,000 by Thursday afternoon.
US spot bitcoin ETFs saw notable net inflows of more than $555 million on Monday, the highest since June: Spot ether ETFs also saw $17 million in inflows, continuing positive momentum for both inves
Simplify Market Neutral Equity Long/Short ETF Analysis 10/16/24DISCLOSURE: As of 10/16/24 I have no open positions in NYSE: EQLS
Simplify Market Neutral Equity Long/Short ETF
EQLS is a market neutral ETF with equal weighting long and short positions. The fund selects long and short positions based on valuations as well as qualitative factors.
The fund has a 9.5% yield, which is quite impressive for returns in a market neutral way. Capital appreciation in this fund is unlikely and it will perform best during large stock market drops. For me, I see EQLS
ELong
Avantis U.S. Small Cap Value ETF Analysis 10/16/24DISCLOSURE: As of 10/16/24 I am long Avantis U.S. Small Cap Value ETF NYSE: AVUV
AVUV is a small cap value fund listed on the New York Stock Exchange. They invest in a broad basket of small cap stocks listed in the United States. The fund chooses investments based on qualitative as well as quantitative factors to achieve the best risk adjusted return possible.
Why AVUV?
The primary reason to consider AVUV is as a long term hold alternative to the S&P 500 or other broad U.S. Indexes. Avantis
Bearish Reversal in VanEck Semiconductor ETF (SMH)The NASDAQ:SMH ETF shows a significant price decline, with a recent drop of 5.40%, as highlighted by the red bar. This price action suggests a bearish reversal after hitting a high of 283.07. The current support level is around 200.49, marking an 18.88% drop from the recent high. Additionally, the Darvas Box indicates a range between 247.16 and 283.07, suggesting potential consolidation in this area before the next directional move. The downward trend aligns with overall market corrections in
BLK - Strong uptrend is intact with new highs Upward trend, which started from the covid bottom of 2020, continues.
The total assets managed by the company reached 11.5 trillion USD, with an annual increase of 2.4 trillion USD.
The company increased its quarterly revenues by 15% to $5.197 billion, exceeding expectations of $5.007 billion.
Earnings per share for the last quarter were $11.46, above expectations of $10.38.
The shares of the company, which announced a net profit of $1.6 billion in this quarter, exceeded the 2021 high
BTCUSD - Bitcoin's good performance will continue in September?!Bitcoin is above the EMA50 and EMA200 in the 4H timeframe and is trading in its ascending channel
Risk ON sentiment in the US stock market or investing in Bitcoin ETF funds has led to its continued upward movement, and you can look for Bitcoin sales positions within the specified supply zone
Capital withdrawals from Bitcoin ETFs or risk OFF sentiment in the US stock market will pave the way down for Bitcoin, which can be sought for Bitcoin buying positions within the defined demand zone
It shoul
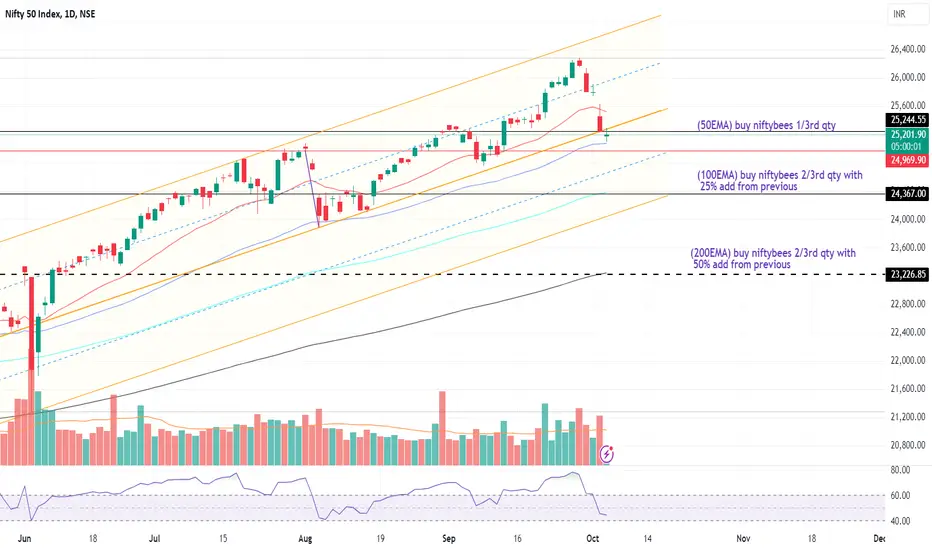
NiftyBees Trading Strategy Using EMA LevelsObjective:
This strategy outlines a simple approach to buying NiftyBees based on 50EMA, 100EMA, and 200EMA levels, and how to gradually increase your position.
Key Steps:
50EMA Buy:
Buy 1/3rd of your total planned investment when the price hits the 50EMA.
Reason: Signals short-term bullish momentum.
Example: If your total budget is ₹90,000, buy ₹30,000 worth at 50EMA.
100EMA Buy:
Buy 2/3rd of your total planned investment at the 100EMA.
Add 25% to your previous 50EMA pos
MAGS (Roundhill Magnificent Seven ETF)... Time to BUY?
MAGS (Roundhill Magnificent Seven ETF)
Weekly TF shows price has pulled back into the +FVG after displacing above the intermediate swing high, completing an External to Internal move. That high intersects the +FVG nicely as confluence of support.
Daily TF shows a Daily +FVG nested within the Weekly +FVG, serving as more confluence of support.
The idea here is if the +FVG holds, price will seek the buy side liquidity highlighted. This would be an Internal to External liquidity movement.
The
MLong
Bitcoin's good performance will continue in September?!Bitcoin is located between EMA50 and EMA200 in the 4H time frame and is trading above the $60,000 level
Risk on sentiment in the US stock market or investing in Bitcoin ETF funds has led to its continued upward movement, and you can look for Bitcoin sales positions within the specified supply range
Capital withdrawals from Bitcoin ETFs or risk off sentiment in the US stock market will pave the way down for Bitcoin. The target of this downward movement will be the level of 63 thousand dollars
It
Rule of 160: History Predicts Start Of Bull-Run This Week!In this analysis I want to take a closer look at previous bull-cycles and Bitcoin's behaviour in the months following the halving.
The vertical yellow line is the date of the halving. The purple rectangle is the price action of the 160 days following the halving.
We can very clearly see a few interesting similarities between the last three cycles:
- The price pumps prior to the halving.
- The price trades sideways for 160 days after the halving.
- The "real" bull-run starts after the sideways
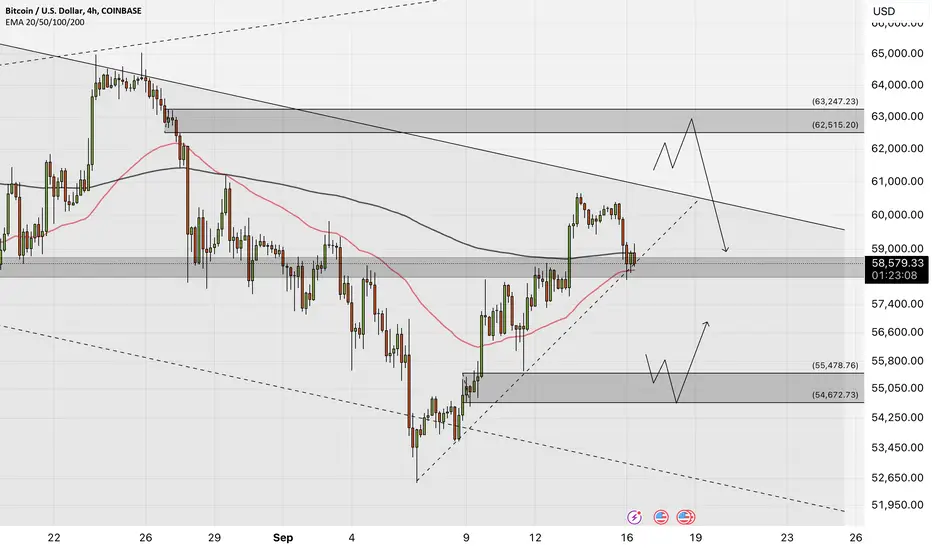
Bitcoin - Where will Bitcoin go after the interest rate cut?Bitcoin is above the EMA50 and EMA200 in the 4H timeframe and is trading above the $60,000 level
Risk On sentiment in the US stock market or investing in Bitcoin ETFs has led to its continued upward movement, and you can look for Bitcoin buying opportunities by maintaining the drawn upward trend line and not breaking it
Capital withdrawals from Bitcoin ETFs or risk Off Sentiment in the US stock market will pave the way for Bitcoin to decline. Selling will be justified after a valid break of the
Bitcoin - Bitcoin reached 60K$!Bitcoin is located between the EMA50 and EMA200 in the 4H time frame and is trading in its descending channel
Risk On sentiment in the US stock market or investing in Bitcoin ETFs has led to its continued upward movement, and you can look for buying positions after Bitcoin corrects to the specified demand zone
Capital withdrawals from Bitcoin ETFs or risk Off sentiment in the US stock market will pave the way for Bitcoin to decline. Sales from the specified supply zone will be rewarded with appr
SPY: Short-Term Selloff Anticipated After Fed Rate Cut DecisionIf you haven`t bought the recent dip on SPY:
Now you need to know that as the Federal Reserve approaches its rate cut decision this week, speculation is high that we may see a larger-than-expected cut of 50 basis points rather than the anticipated 25. This could trigger a short-term selloff in equities, including the SPY (S&P 500 ETF), despite the initial market reaction.
The market often exhibits a “buy the rumor, sell the news” behavior, and this situation could be no different. With expect
$BTC doing exactly what we said...Was away and have not posted here in some time. Was away and had a few things neded to take care of. Please see profile for more info on that.
Will consolidate everything we have said on #Bitcoin over last few days.
CRYPTOCAP:BTC was worth a shot early this week or late last week. We bought overnight Sun - Mon.
Mid 60's is likely around the corner.
Don't see #BTC in the high 60's but 67k is definitely possible.
Buy volume is still WEAK. Not crazy about that BUT at least it has been more b
Bitcion - buy positions!Bitcoin is located between the EMA50 and EMA200 in the 4H time frame and is trading in its descending channel
Bitcoin moved in the direction of its bullish analysis of the previous day and reached the target
Risk on sentiment in the US stock market or investing in Bitcoin ETFs has led to the continuation of the upward movement and it is possible to look for positions to buy it from the demand zones
It should be noted that there is a possibility of heavy fluctuations and shadows due to the moveme
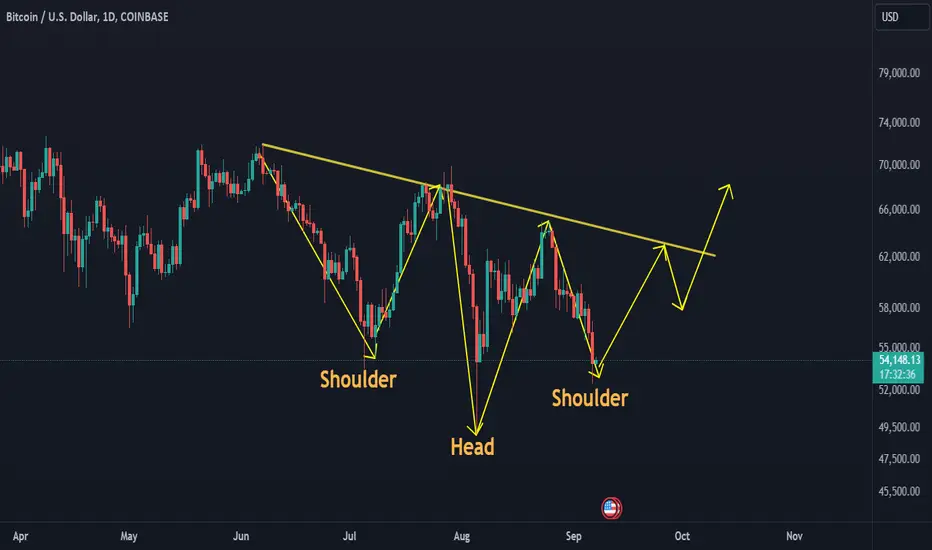
Key Signals Point to a Bitcoin ReversalCurrently, Bitcoin's price is hovering around a strong support level in the short term, and we're seeing early signs of a potential reversal pattern, possibly forming a macro (inverted) head-and-shoulders setup. Based on other technical indicators, this region between $47k and GETTEX:54K is likely to attract significant buying interest, positioning it as a key accumulation zone for long-term holders and institutional buyers alike.
- The only thing that could stop us now is a recession, but do
Major earnings are times to hedge or BTDAs far more eloquent and technical writers have covered (spotgamma, etc) - it's very clear that the markets in general are driven by single name options on the largest market cap companies.
And to help visualize just how much volatility can happen around earnings on these single names, I wanted to be able to visualize those earnings dates and impacts against some of the major benchmark ETFs like SPY or QQQ.
So far, I hadn't seen a place that gives this a more clear presentation so here is my
Bitcoin - Heavy Capital Exit from Bitcoin ETF After labour dayBitcoin is lower than the EMA50 and EMA200 in the 4H timeframe and is trading in its descending channel
The risk on sentiment in the US stock market or the entry of capital into bitcoin ETFs has resulted in the start of the upward movement, and after bitcoin in the specified supply zone, it can be entered into bitcoin sell
It should be noted that heavy fluctuations and shadows are possible due to the movement of whales in the market, and the capital management of capital in the cryptocurrency ma