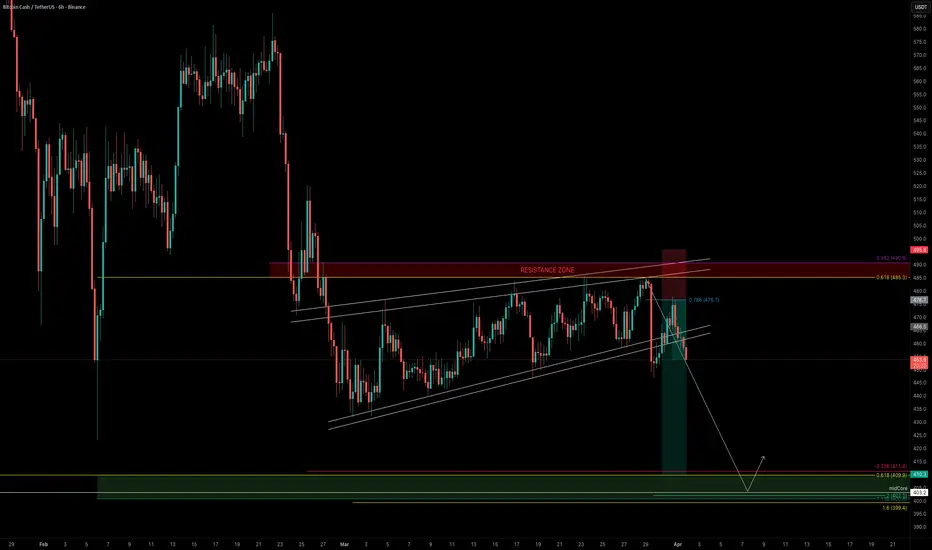
BCH Weak Structure — Bears Taking ControlBCH has been consolidating for the past 33 days, forming a clear sideways range that now resembles a bearish flag structure below a key support-turned-resistance zone.
The loss of the $500 psychological level is significant not just structurally, but also from a sentiment perspective. What was once support is now acting as a ceiling.
Market Structure & Context
Zooming out, BCH is showing:
Weak recovery attempts
Lower highs within the range
Lack of bullish momentum
Repeated rejections
Fibonacci Retracement
SOL Clean Rejection — Eyes on Lower TargetsSOL has been trading in a clear bearish market structure, following a clean Elliott Wave sequence with a full 5-wave move down followed by a corrective ABC → making it ideal for shorts at key resistance levels.
Recent Price Action
Today, SOL tapped the 1.0 trend-based Fibonacci extension at $86.11, aligning with the 0.5 Fib retracement, and saw an immediate rejection.
Adding to that, we also had the 21 daily EMA/SMA resistance zone between $86–$87.75, providing even more confluence for the
GOLD - Consolidation near the trigger. Uptrend and newsFX:XAUUSD is trading near key resistance at 4,735, finding support from a weaker dollar amid hopes for a de-escalation of the conflict in the Middle East
Key factors: Trump did not anticipate this turn of events in the Middle East, shifting responsibility for the strait to NATO countries. Earlier this week, the president stated that he was ready to end the war even without opening the strait.
A lot of economic news is expected today.
ADP Employment Change – a reading below the forecast wi
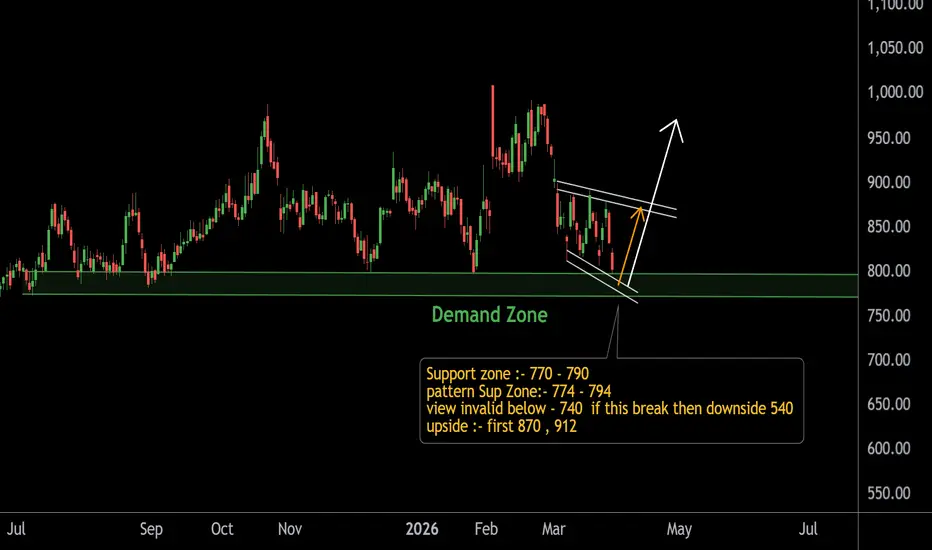
NAM_INDIA Key Demand Zone – Make or Break Levels AheadThis is the higher time frame view showing a strong demand zone around 770 – 790, where price has reacted multiple times in the past.
Key Observations:
• Price is currently trading near a falling channel pattern
• Testing an important demand/support zone
• Compression near support hints at a possible volatility expansion ahead
Important Levels:
• Support Zone: 770 – 790
• Pattern Support: 774 – 794
• Invalidation Level: Below 740 (strong bearish continuation possible)
Upside Potential:
•
EURUSD Sell at 1.14900 as Strong USD and Oil Shock Weigh on EuroHey Traders, in today's trading session we are monitoring EURUSD for a selling opportunity around the 1.14900 zone. EURUSD is trading in a downtrend and currently is in a correction phase in which price is approaching the trendline resistance around the 1.14900 support and resistance area.
From the macro side, the US Dollar remains strongly supported by safe-haven demand, posting its strongest monthly gain since July as Middle East tensions continue to fuel recession fears and keep investors po
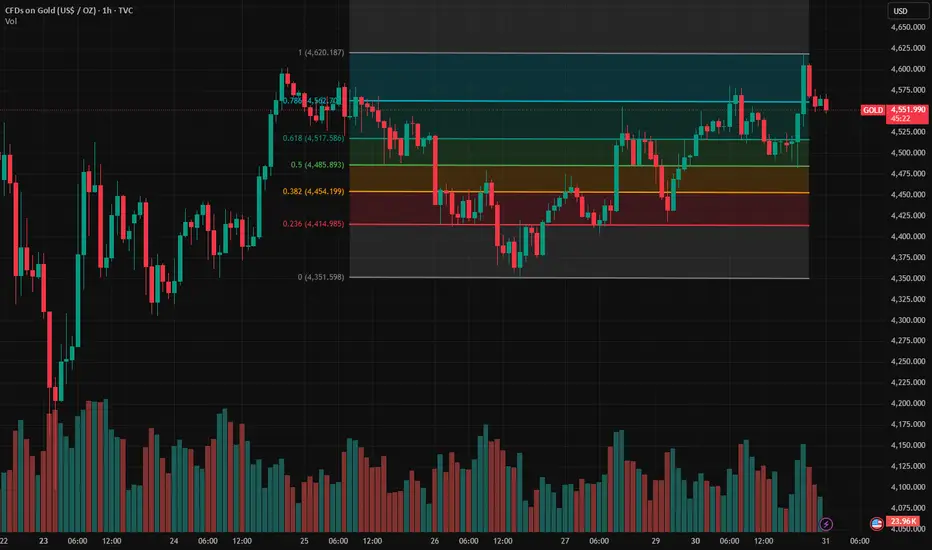
GOLD - Mixed fundamental data. Range: 4550 – 4600 ICMARKETS:XAUUSD is testing the 4,600 level within a local uptrend and forming a short squeeze. The market is under pressure from a global downtrend, a strong dollar, and high oil prices...
During his speech yesterday, Powell stated that long-term inflation expectations in the U.S. remain under control. However, it can be assumed that high oil prices will have an extremely negative impact on inflation and the markets...
Reports of a possible winding down of the U.S. military campaign again
XRPUSDT - Ready for a decline. Focus on 1.27–1.14BINANCE:XRPUSDT is preparing to transition from a consolidation phase to a distribution phase. The altcoin appears weaker than the broader market...
Bitcoin confirms the bearish market structure; against this backdrop, XRP looks much weaker than the flagship.
XRP maintains a local bearish trend that aligns with the global one. The altcoin is forming a trading range of 1.3612–1.3152 and is testing the support level. If XRP breaks below 1.3152, the decline could continue to 1.269, and then
XAUUSD Holds Firm, but the Real Test Still Sits Above
XAUUSD is still rebuilding after the recent sell-off.
Gold remains supported as geopolitical tension stays elevated. The current backdrop still favours safe-haven demand on paper, with the United States and Israel maintaining an aggressive posture while broader regional risks remain unresolved. At the same time, despite repeated threats around Hormuz and the Red Sea, the market has not yet seen a full disruption. Iran has kept the route open so far, and that matters.
This is why gold is not
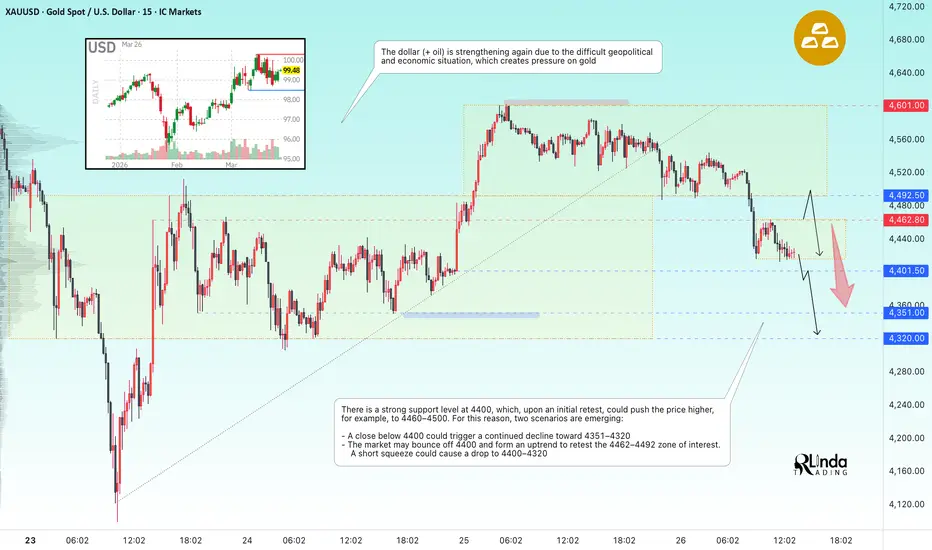
GOLD - A countertrend correction before a decline ICMARKETS:XAUUSD is under pressure again at the start of the week. A counter-trend retest of the 4555–4600 range is forming amid a strong dollar and rising oil prices.
The conflict in the Middle East is escalating, and threats to global trade are mounting. Iran is preparing for a possible U.S. ground invasion of Kharg Island. With the risk of the Bab el-Mandeb Strait being blocked by Yemeni Houthis, such a blockade would further boost the dollar and oil prices, exerting enormous pressure
MSFT: Bullish BC Holding While HTF Bearish WCL Looms AboveMSFT is sitting at a very clean decision point.
The 1H bullish ABC structure is still active, and price is currently reacting around the BC zone , which is the key area that can fuel continuation toward the marked C target .
So in the short term, this chart still favors upside as long as BC holds .
However, the bigger trap here is ignoring the red HTF bearish WCL overhead. That zone tells me the broader chart still has meaningful higher-timeframe resistance waiting above, so this is no
NZDUSD - Medium-term potential: a decline to 0.5658FX:NZDUSD , after breaking through support, is entering a distribution phase and is heading toward the liquidity zone. A bounce is possible before the decline continues
An active downtrend is in place; the currency pair (within the distribution phase) is aiming to test the key support level at 0.5711. Against the backdrop of a strong dollar, the NZD is facing selling pressure.
The market is in a bearish trend (against the backdrop of a strong dollar, which is poised to continue its rise).
TAO Range Trap — Liquidity Sweep SetupTAO continues to deliver clean, technical setups.
After nearly tapping the -1 Fibonacci at $378, price shifted into a downtrend and is now gradually moving toward a key level around $300, an area with strong confluence for a long setup.
Current Structure
Over the weekend, TAO has been trading sideways in a tight range → similar to last week’s setup.
This kind of price action often builds liquidity on both sides before the next move.
Trade Idea — Liquidity Sweep Into Support
What I’d li
Trend (1H – SOL/USD)📉 Trend (1H – SOL/USD)
Clear downtrend
Lower highs + lower lows
Price below:
falling trendline (dashed)
average (red – acts as dynamic resistance)
➡️ Until this changes = bias short
📊 Key levels
🔴 Support:
81.3 – currently tested (very important)
79.7 – next level (if 81 breaks → quick move)
76.9 – deep target
🟢 Resistance:
84.2 – first local resistance
86.2
87.6 + MA – key trend reversal area
📉 Price Action
Consolidation at low range (81–83)
No strong rebound → weakness
Every bounce = wea
GOLD - A short squeeze before the drop. Interest in 4435ICMARKETS:XAUUSD rolls back after a short squeeze at the daily level and closes the weekly session below 4,500. Fundamental factors, a rising dollar, and oil prices are putting pressure on the metal...
The geopolitical situation continues to escalate. The situation is complex; the West is trying to convince the public that there will be no ground operation in the Middle East, but all actual actions point to a protracted war. The dollar and oil may continue to rise in the medium term. Agai
ETHUSDT - The crypto winter continues. Support has broken down BINANCE:ETHUSDT is forming a counter-trend correction after hitting new lows. The market is reminded that it is still in crypto winter and may continue to fall...
Bitcoin is returning to a downtrend after a failed attempt to retest the 72K zone. Bears are dominating, and the downtrend continues.
Weak Bitcoin is negatively impacting altcoins
Ethereum may test the 2025–2038 liquidity zones. A short squeeze would provide a good signal for a potential decline. Earlier, Ethereum broke the supp
DAX (GER40) Is Sitting at a Possible M PatternHi,
Last week US equity market indices fell hard and along with that world wide indices participated too. But comparatively DAX showed more resilience than US equity indices such as NASDAQ and SNP500. Now we can see that DAX is sitting at an M pattern. As the market conditions are not great at the moment for a bullish sentiment, we will have to wait and watch how the market opens this week. If this M pattern or an extended M pattern works, thus may be a good sign for US equity indices too as al
XAUUSD remains technically weak.Gold Faces a Macro Tailwind, but the Chart Still Leans Defensive
XAUUSD may benefit from escalating geopolitical tension, but the technical structure is still arguing for caution.
Gold is entering a difficult phase where the macro story and the chart are no longer moving in the same direction.
On the macro side, the backdrop is clearly supportive. A closed strait, expanding military activity, and rising regional instability all strengthen the case for safe-haven demand. When conflict broadens
BNB/USDT 4H Chart Review📉 1. Market Structure
There was an ascending channel (purple lines) → it was broken below.
This = structure change → bullish → bearish (short-term)
The last move is a strong downward impulse (breakdown).
👉 Conclusion: short-term trend = downward.
📊 2. Key Levels
🔴 Support:
607–611 → currently tested (very important)
582 → next target
545 → deep target (if panic selling)
🟢 Resistance:
636
656
685 → key HTF resistance
⚠️ 3. What just happened
Breakdown from the channel
Loss of level ~636
Now you
GOLD - The market is in a bear marketICMARKETS:XAUUSD is trading within the 5,351–5,480 range, but the outlook remains bearish. Bears continue to dominate the market as the dollar and oil prepare for an uptrend.
The situation in the Middle East is contradictory; despite rumors of negotiations, there are signs of an escalation.
Trump announced a 10-day extension of the pause in strikes on Iran’s energy facilities, but markets do not trust these statements and expect the war to continue.
Risks of escalation are boosting demand
EURUSD - The market is poised to break support. Downtrend FX:EURUSD is forming a pre-breakdown consolidation, the goal of which may be to break through the range support and the trend line...
The breakdown of support trend lines on the D1 chart indicates a weakening of the bullish trend and the formation of a U-pattern. Global trigger at 1.1400. If the main trigger is broken, the market may shift into a global downtrend.
Locally, the dollar is strengthening, which negatively affects the euro, which is already preparing for a decline within the ma
GOLD - The market is once again dominated by bears...ICMARKETS:XAUUSD tested the 4,600 level, but the retest ended in a short squeeze. The two-day rally was cut short amid renewed uncertainty surrounding the ceasefire talks in Iran.
Geopolitics: Tensions in the Middle East remain high. The parties cannot find a way to begin negotiations; the West’s 15-point ceasefire proposal is completely at odds with Iran’s five conditions.
The main question is: with whom is Trump negotiating if Iran is not participating...
Gold came under pressure amid e
BITCOIN - The bears held the 72K resistance level. Rebound BINANCE:BTCUSDT.P currently appears stable amid the chaotic market for indices, metals, and energy resources. Is this a hedge asset?
Bitcoin is bouncing off the 72K resistance level, and the market continues to keep the flagship asset in a downtrend. However, globally, Bitcoin looks fairly stable against the backdrop of other markets that are going crazy.
Technically, the price (locally) looks bearish. After rebounding from the trading range resistance, the price may test the local liqui