AUDJPY BuysIn recent weeks, we’ve seen sustained JPY weakness, with a clear directional trend and repetitive structural behavior across multiple pairs.
In this specific case, AUDJPY has consistently respected a pattern: each impulsive leg higher is followed by a pullback, with the daily 20 EMA acting as the key dynamic support on the retest.
At the moment, price is trading directly on that moving average. Dropping down to the 4H timeframe, we can clearly identify a solid bullish structure, with price rea
Fractal
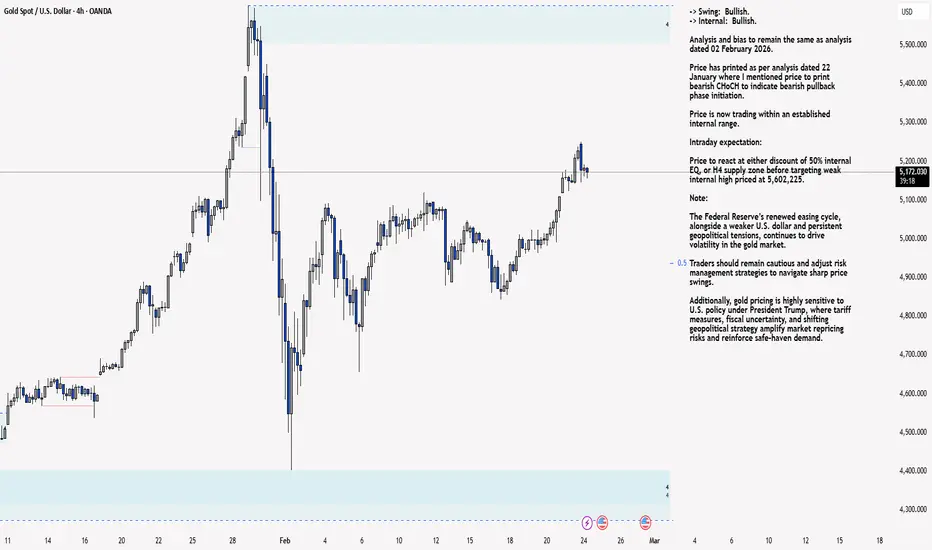
XAU/USD 25 February 2026 Intraday AnalysisH4 Analysis:
-> Swing: Bullish.
-> Internal: Bullish.
Analysis and bias to remain the same as analysis dated 02 February 2026.
Price has printed as per analysis dated 22 January where I mentioned price to print bearish CHoCH to indicate bearish pullback phase initiation.
Price is now trading within an established internal range.
Intraday expectation:
Price to react at either discount of 50% internal EQ, or H4 supply zone before targeting weak internal high priced at 5,602,225.
Note
Silver – Range Breakout, Momentum BuildingSilver has broken out of the multi-week range and is now pushing toward the PMH (Previous Month High). Momentum is clearly strong, and the bullish expansion looks structurally supported.
That said, Silver remains highly volatile. Even small counter-moves can translate into significant PnL swings, so risk management is critical.
The only scenario where I would consider entering today is on a controlled pullback into the 89–90 zone, ideally with liquidity collection and confirmation before conti
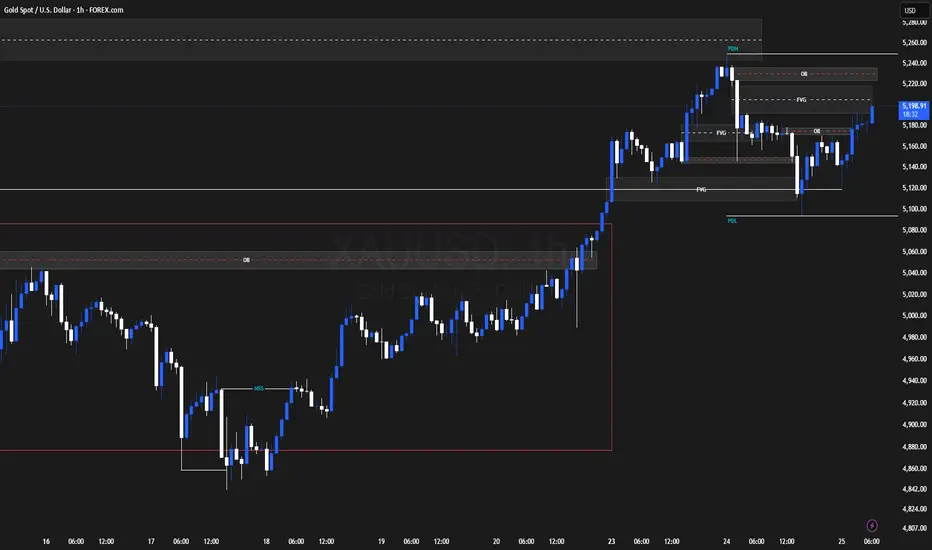
Gold – Clean HTF Retracement, Continuation in FocusYesterday delivered a textbook long opportunity in Gold. As outlined in the prior analysis, after the upside breakout, we expected a higher-timeframe retracement. On H1, price traded back to mitigate the FVG, which aligned with the PDL (Previous Day Low) — a strong confluence zone.
It was clear that price showed no real acceptance below that level, signaling a liquidity grab rather than a breakdown back into the prior range. The move was engineered to collect liquidity before continuing higher.
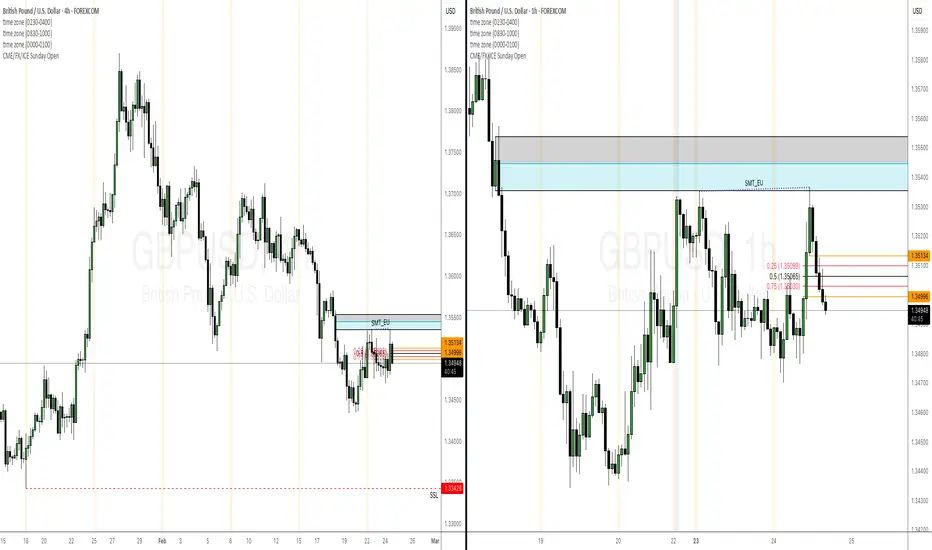
gbpusd shortcable short setup in play , run above monday high providing smt w/ EU
today (tuesday) 10a fvg from h1 timeframe should act as inversion.
further out DOL around 1.33500 lvl , weekly swing low
low hanging fruit draw resides at previous thurs/fri ssl eql
utilize EG chart for added confluence (EG bullish orderflow)
XAU/USD 24 February 2026 Intraday AnalysisH4 Analysis:
-> Swing: Bullish.
-> Internal: Bullish.
Analysis and bias to remain the same as analysis dated 02 February 2026.
Price has printed as per analysis dated 22 January where I mentioned price to print bearish CHoCH to indicate bearish pullback phase initiation.
Price is now trading within an established internal range.
Intraday expectation:
Price to react at either discount of 50% internal EQ, or H4 supply zone before targeting weak internal high priced at 5,602,225.
Note
Idk just my view of the past pasted into the future
Call me crazy or whatever you want, but i can see when things repeat. Will it continue? I don't know.
Just copy the weekly fractal on the log chart from 5 nov 2018 until now to 13 jan 2025 and tweak only height to hit horizontal + diagonal support lines and fib lvls and see.
Remember i'm not a specialist or chart guy or have any clue about this whatsoever.
Can't show a picture since i have no subscription...
XAU/USD 23 February 2026 Intraday AnalysisH4 Analysis:
-> Swing: Bullish.
-> Internal: Bullish.
Analysis and bias to remain the same as analysis dated 02 February 2026.
Price has printed as per analysis dated 22 January where I mentioned price to print bearish CHoCH to indicate bearish pullback phase initiation.
Price is now trading within an established internal range.
Intraday expectation:
Price to react at either discount of 50% internal EQ, or H4 supply zone before targeting weak internal high priced at 5,602,225.
Note
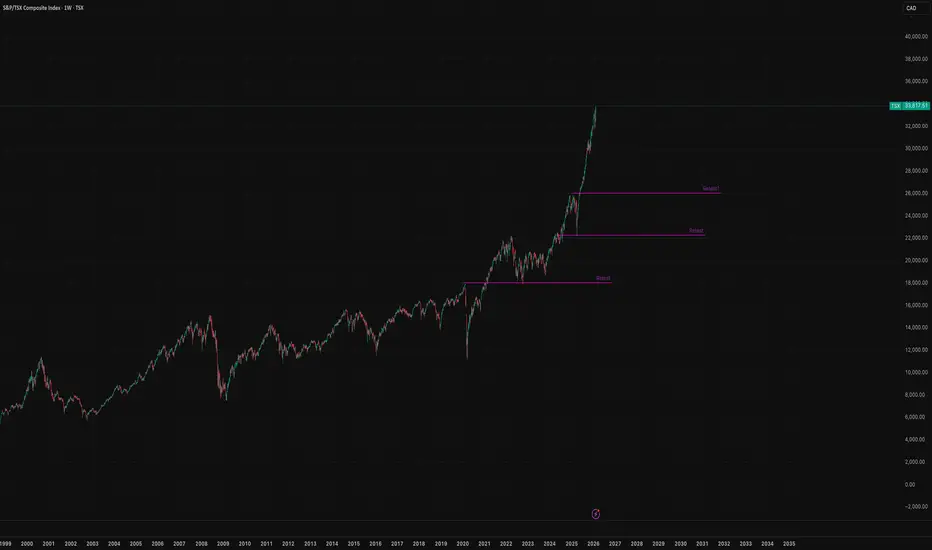
TSX Potential ImbalanceThe S&P/TSX Composite enters a pivotal week as Canada’s major banks report ( TSX:BMO TSX:RY TSX:CM TSX:BNS TSX:NA TSX:TD ) earnings within a compressed timeframe (Feb 24-26, 2026), creating the potential for short-term market imbalance. With financials representing roughly 30% of the index, even modest earnings disappointments or cautious forward guidance could disproportionately pressure the broader market. Investors are closely watching credit loss provisions, net interest margin
MNQ Analysis & Day Trading - Friday March 14 2025 part 21-1-2 day for $0. cool.
Week: 10-9-2, +$754.
very up and down week, but no trade risk is more than $125.
any week above $500 is a good/great week.
doing that while winning just barely 50% feels even better to me.
-------------
As a learning, beginner day trader I go through the market replay predefining what I am looking for to enter a trade and walk through my thoughts as I experience the market action bar by bar throughout the entire day to see how I handle various events and assess my exec
MNQ Analysis & Day Trading - Friday March 14 2025 part 10-1 so far on the day, -$120.
continue the day with me in part 2.
-------------
As a learning, beginner day trader I go through the market replay predefining what I am looking for to enter a trade and walk through my thoughts as I experience the market action bar by bar throughout the entire day to see how I handle various events and assess my execution.
This is for me and others to learn if you desire.
MNQ Analysis & Day Trading - Friday February 20 2026 part 2good not great 2-1 day, +$295.
excellent week: 15-7-2, +$1,447.
no trade risking more than $125.
-------------
As a learning, beginner day trader I go through the market replay predefining what I am looking for to enter a trade and walk through my thoughts as I experience the market action bar by bar throughout the entire day to see how I handle various events and assess my execution.
This is for me and others to learn if you desire.
MNQ Analysis & Day Trading - Friday February 20 2026 part 1bangarang 2-0 so far on the day, +$420. continue the day with me in part 2.
-------------
As a learning, beginner day trader I go through the market replay predefining what I am looking for to enter a trade and walk through my thoughts as I experience the market action bar by bar throughout the entire day to see how I handle various events and assess my execution.
This is for me and others to learn if you desire.
MNQ Analysis & Day Trading - Thursday February 19 2026 part 3C+ day by me and a market with do direction or follow through.
3-3 day, -$31.
-------------
As a learning, beginner day trader I go through the market replay predefining what I am looking for to enter a trade and walk through my thoughts as I experience the market action bar by bar throughout the entire day to see how I handle various events and assess my execution.
This is for me and others to learn if you desire.
MNQ Analysis & Day Trading - Thursday February 19 2026 part 2below average vision, 1-3 so far on the day, -$194. continue the day with me in part 3.
-------------
As a learning, beginner day trader I go through the market replay predefining what I am looking for to enter a trade and walk through my thoughts as I experience the market action bar by bar throughout the entire day to see how I handle various events and assess my execution.
This is for me and others to learn if you desire.
MNQ Analysis & Day Trading - Thursday February 19 2026 part 1wicky 0-1 so far on the day, -$119. continue the day with me in part 2.
-------------
As a learning, beginner day trader I go through the market replay predefining what I am looking for to enter a trade and walk through my thoughts as I experience the market action bar by bar throughout the entire day to see how I handle various events and assess my execution.
This is for me and others to learn if you desire.
MNQ Analysis & Day Trading - Wednesday February 18 2026 part 3grinded a 2-2 day.
C+ day from a vision, patience and execution perspective.
+$35
-------------
As a learning, beginner day trader I go through the market replay predefining what I am looking for to enter a trade and walk through my thoughts as I experience the market action bar by bar throughout the entire day to see how I handle various events and assess my execution.
This is for me and others to learn if you desire.
MNQ Analysis & Day Trading - Wednesday February 18 2026 part 2battling 1-2 so far on the day, -$69. continue the day with me in part 3.
-------------
As a learning, beginner day trader I go through the market replay predefining what I am looking for to enter a trade and walk through my thoughts as I experience the market action bar by bar throughout the entire day to see how I handle various events and assess my execution.
This is for me and others to learn if you desire.
MNQ Analysis & Day Trading - Wednesday February 18 2026 part 1rough and rookie 0-2 so far on the day, -$228. continue the day with me in part 2.
-------------
As a learning, beginner day trader I go through the market replay predefining what I am looking for to enter a trade and walk through my thoughts as I experience the market action bar by bar throughout the entire day to see how I handle various events and assess my execution.
This is for me and others to learn if you desire.
Crystal Ball Fractal LONG - For FunMade this initial fractal bar prediction in mid January targeting bearish move down to $66. Based on basic cycle completion, sup/res at fibs, speed fan for timing, and RSI divergence - it's followed it to a T.
Might as well use the same strategy plus some extensions to predict upside. Just a fun prediction to see how reliable fundamental trend analysis could be in a relatively fresh symbol.
BTC Potential Bottom Scenario - Strategy OutlineHi everyone,
I’ve started deploying some capital into BTC since 77K, rotating profits from gold and silver along with some cash positions. My plan is to accumulate and hold during what I believe is a bottoming process that could take another 3–5 months.
This still aligns with my broader expectation that Trump may actively promote the crypto market starting around June/July ahead of the mid-term elections.
To hedge my current spot exposure, I’m considering buying a PUT option around the 72–73K
XAU/USD 20 February 2026 Intraday AnalysisH4 Analysis:
-> Swing: Bullish.
-> Internal: Bullish.
Analysis and bias to remain the same as analysis dated 02 February 2026.
Price has printed as per analysis dated 22 January where I mentioned price to print bearish CHoCH to indicate bearish pullback phase initiation.
Price is now trading within an established internal range.
Intraday expectation:
Price to react at either discount of 50% internal EQ, or H4 supply zone before targeting weak internal high priced at 5,602,225.
Note
EURUSD Buy limitAsian session liquidity already swept below the lows, showing sell side exhaustion. I’m looking for a potential reversal as price starts targeting upside liquidity. Waiting for price to retrace into the marked imbalance zone for my buy limit entry, using the sweep as confirmation of liquidity grab. If reaction holds, expectation is continuation towards higher liquidity and intraday highs