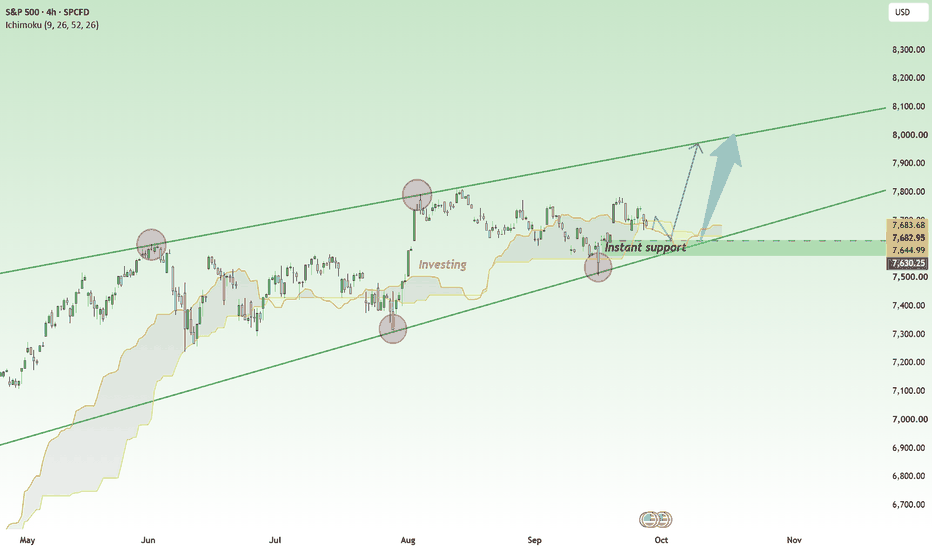
SPX – Investors Are Still Willing to Pay for GrowthSPX continues to display an investment-driven bullish structure rather than simply a short-term rally . Recent pullbacks have yet to show any meaningful signs of capital leaving the market. Instead, buyers continue to step in at lower prices, suggesting that investors are using weakness to adjust and rebuild equity exposure.
From a fundamental perspective, the key story remains the earnings growth potential of U.S. companies, particularly within technology and AI . As continued investment in
Investing
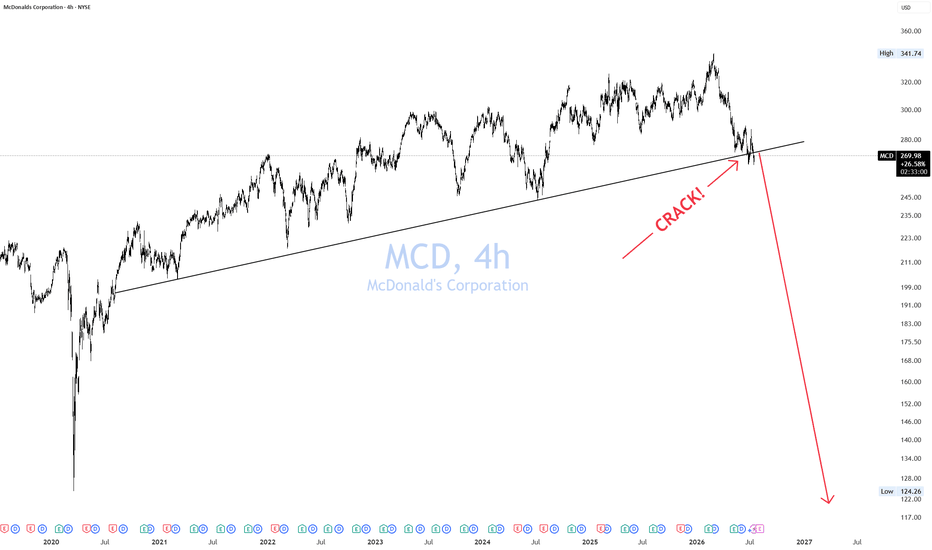
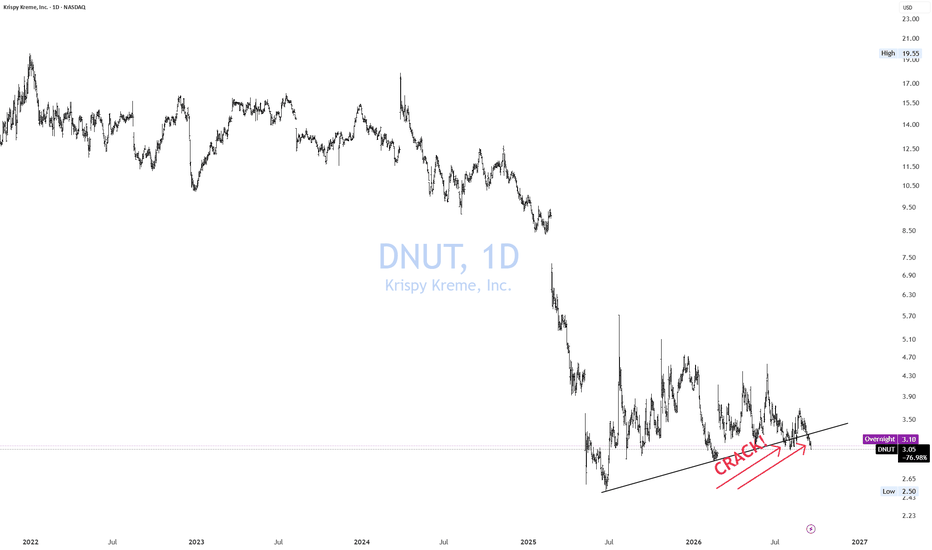
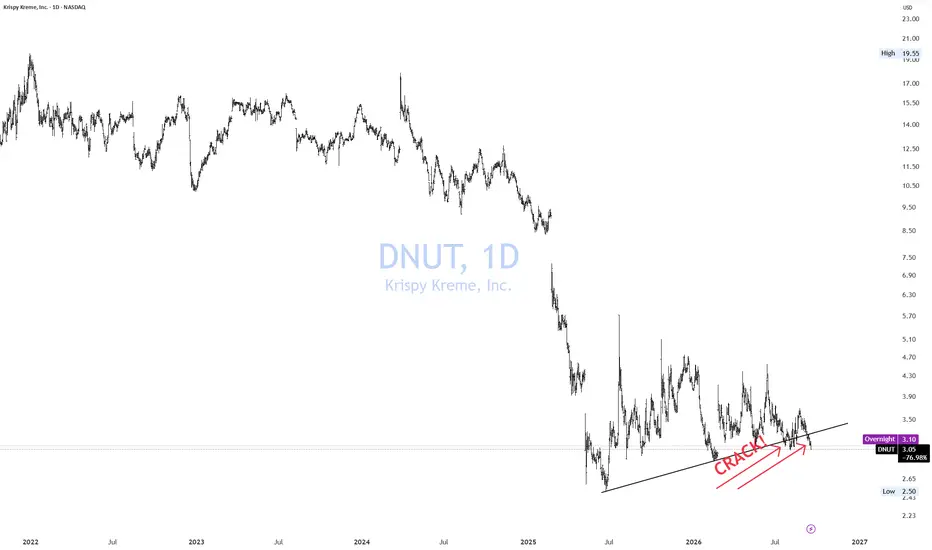
MCD Cracking!Short and Sweet!
Consumer is weakening
Fewer customers walking in
Stock is too expensive for its industry
Margins are under pressure
Competition has intensified
Forget about growth!
It's not by chance that MCD is cracking a key area.
Great short opportunity. No one should be long this.
If you enjoy the work: 👉 Drop a solid comment. Let’s push it to 7,000 and keep building a community grounded in raw truth, not hype.
SMTC – Breakout Above Previous High | Momentum AcceleratingHello Everyone, Followers,
I have been busy lately and less active in Tradingview. Other reason is my scans did not provide quality setups. This week I will share only one, let's drill down.
Semtech Corporation (SMTC) is showing one of the cleaner breakout structures on my watchlist.
After building a series of higher lows from the July bottom, price has now pushed through the previous major high around $176–177 and accelerated toward $185.
What catches my attention is the structure behind th
Microsoft is four ATRs above its 200-week EMAMicrosoft is one of the best businesses in the market right now, and on this chart it's still not a buy. Both of those can be true at once.
The business side first. In its April to June quarter Microsoft grew revenue 18%, turned 45% of it into operating profit, and grew Azure and its other cloud services 43%. There's very little wrong with that.
The chart side is about price, not quality, and I read it through three gates.
Gate 1, the trend. Passing. Price is above the 50-week EMA, the 50-we
S&P 500 Daily Chart Analysis For Week of Sep 25, 2026T echnical Analysis and Outlook:
In last week's S&P 500 trading session, the index rose sharply, reaching the key Mean Resistance levels of 7,670, 7,722, and 7,755. Following this ascension, the index experienced a significant decline, trading at the inverse support level labeled as the Mean Resistance of 7,670.
However, it quickly rebounded toward the newly established Mean Resistance at 7,767, indicating a strong possibility of hitting and retesting the Outer Index Rally target of 7,815, vi
EUR/USD Daily Chart Analysis For Week of Sep 25, 2026Technical Analysis and Outlook:
In the previous week's eurodollar trading session, the currency continued its decline, tumbling to our Interim Inner Currency Dip 1.142 and Key Support 1.136, establishing a very weak Mean Support at 1.138.
However, there is a possibility of a further incline toward the Mean Resistance level of 1.142 before the euro triggers an Intermediate In-Force Retracement to trade the Mean Support at 1.138 price.
With the continuation on the downside, the Eurodollar is i
Bitcoin(BTC/USD) Daily Chart Analysis For Week of Sep 25, 2026Technical Analysis and Outlook:
Bitcoin experienced a significant upward movement in last week's trading session, completing the Inner Coin Rally at $86,800 after successfully retesting the Key Resistance level at $81,700. A sharp retracement from these vital targets followed this.
Currently, the trading price indicates a potential rise in the In-Force Rebound, targeting a retest of the Key Resistance level at $86,600, with the Inner Coin Rally completed at $86,800. Market participants should
RSKD: When fraudsters work overtime and Riskified profits from iWhile most investors debate artificial intelligence, Riskified( NYSE:RSKD ) is already using it where mistakes cost real money. The company helps the world's largest online retailers distinguish genuine buyers from fraudsters, analyzing billions of dollars in transactions in real time. The bigger e-commerce gets, the more expensive every mistake becomes.
Fundamentals
The latest quarter showed the business continues to gain momentum. Revenue grew 7 percent year over year to 88.3 million dolla
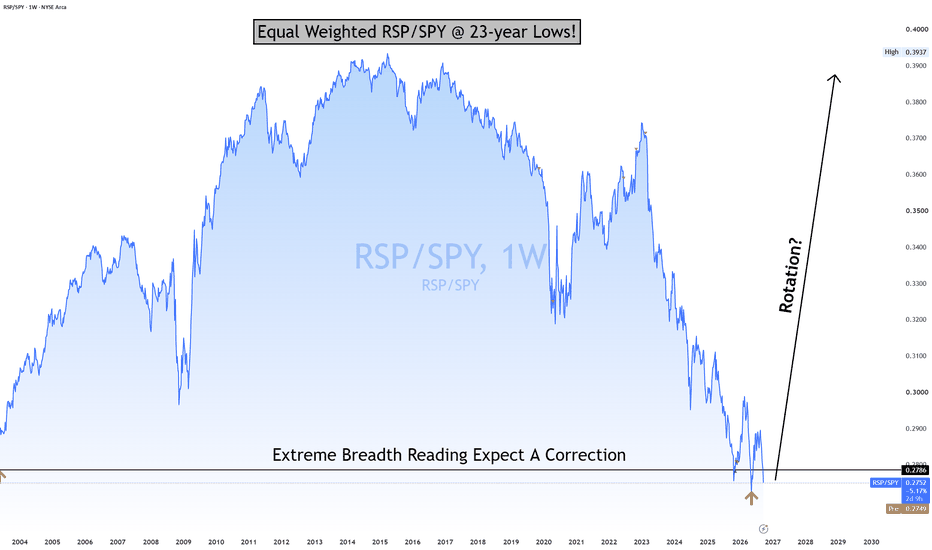
S&P 500 CAUTION!!🚨 The S&P 500 may look strong—but underneath the hood, market breadth just hit a 23-year extreme.
The RSP/SPY ratio—equal-weight S&P 500 vs. cap-weighted S&P 500—has fallen back to levels last seen around 2003.
That means the index is becoming increasingly dependent on a small group of mega-cap stocks while the average stock continues to lag.
Historically, extremes like this don’t stay stretched forever.
Two ways this resolves:
1. Rotation: money flows out of the leaders and into the broade
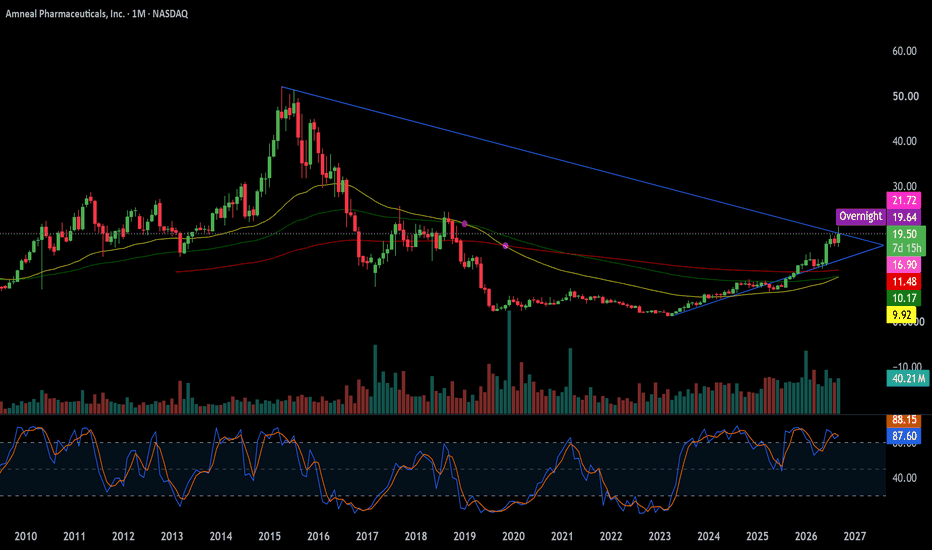
Can a Single FDA Approval Reshape an Entire Pharma Juggernaut? In a market captivated by AI and semiconductor stocks, mid-cap healthcare often operates quietly in the background. Yet Amneal Pharmaceuticals (NASDAQ: AMRX) recently broke that quiet. On September 18, 2026, the FDA approved Amneal's generic Lanreotide Injection, a copy of Ipsen's Somatuline Depot, which generated $983 million in U.S. sales over the 12 months ended July 2026 (IQVIA). The approval added fresh momentum to a stock already up nearly 50% year-to-date. This event prompts a broader, mu
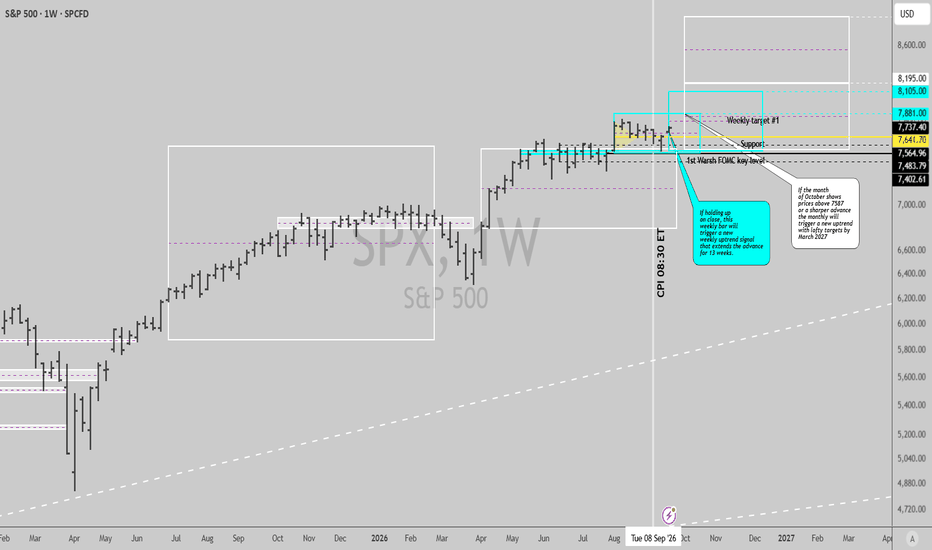
SPX Time@Mode #2: Downtrend erased, Friday decides the advanceThe SPX weekly downtrend triggered on the 9/16 FOMC hike and has been retraced away: the bar trades 7,696.42 on Monday, back above the range the signal was built on.
This week the tape has to trade the hike into September's live data calendar without the FOMC available as a hiding place: S&P Global Flash PMI Wednesday, Initial Jobless Claims and New Home Sales Thursday, Durable Goods and the SCOOS credit survey Friday, plus Xi Jinping in Washington and Costco after the Thursday close.
Fed gov
S&P 500 Daily Chart Analysis For Week of Sep 18, 2026Technical Analysis and Outlook:
In last week's trading session, the Spooz dropped and rebounded sharply with an eye on the vital Mean Resistance at 7,670, with strong potential to hit the next Mean Resistance identified as 7,722.
Nevertheless, the current trading price action demonstrates a high probability that the S&P 500 index will see steady-to-lower moves in the upcoming session. This would hint at a drop to the Mean Support at 7,610 before rebounding toward the targets stated above.
How
EUR/USD Daily Chart Analysis For Week of Sep 18, 2026Technical Analysis and Outlook:
In last week's trading session, the Eurodollar tumbled to the Mean Support level of 1.146, then bounced sharply to target the Mean Resistance level of 1.150, with a possibility of a further incline to the Mean Resistance level of 1.155, with the respective targets serving as In-Force triggering points.
On the downside, the Eurodollar continues to show a bearish bias, targeting the critical outcome identified as the interim Inner Currency Dip, priced at 1.142.
Bitcoin(BTC/USD) Daily Chart Analysis For Week of Sep 18, 2026Technical Analysis and Outlook:
Bitcoin encountered a powerful upward movement in last week's trading session, successfully retesting the Key Resistance level at $81,700.
Following this, the next target price is the completed Inner Coin Rally at $82,200, with an eye on the major advancement to the next Inner Coin Rally at $86,800.
On the downside, the current trading price indicates a likely reignition of the In-Force Retracement to the Mean Support at $78,000, from the Key Resistance level
FSLR: U.S. Solar Tariffs Could Create a Pricing-Power CatalystFirst Solar is setting up an interesting fundamental and technical scenario as the U.S. moves closer to imposing steep anti-dumping and countervailing duties on solar imports from India, Indonesia and Laos.
The key point is not simply that tariffs make imported panels more expensive.
First Solar uses CdTe thin-film technology, while the current trade case focuses on crystalline-silicon photovoltaic products. That gives FSLR a potentially favorable competitive position if imported c-Si modules
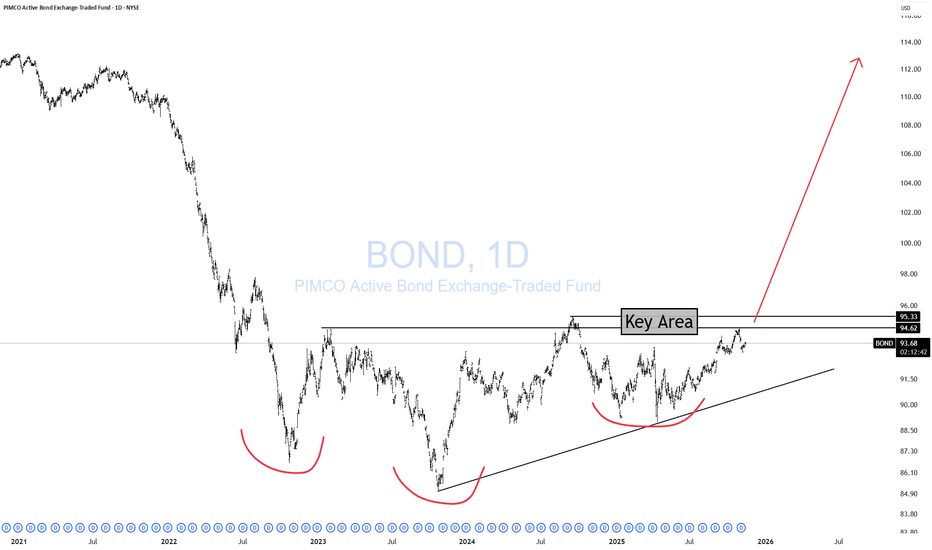
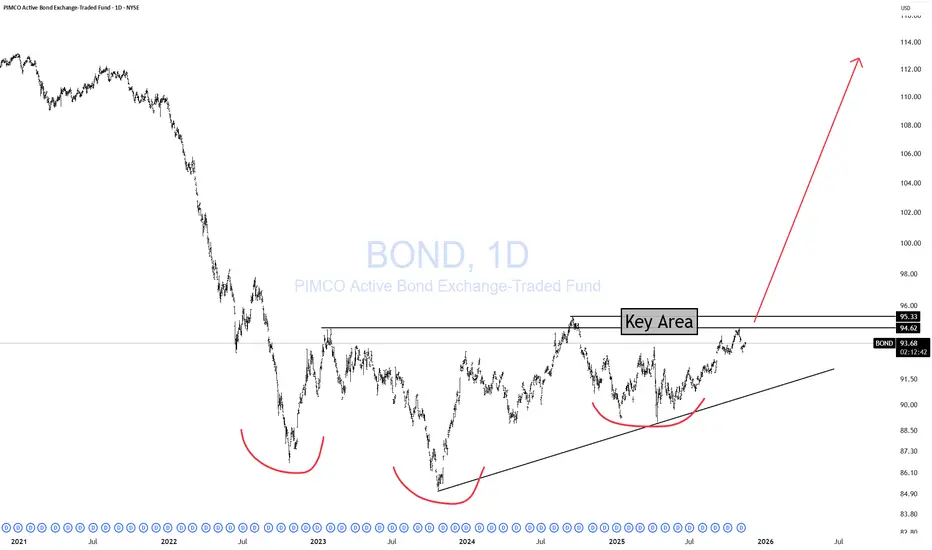
BOND Break Out?💣 Bonds Near a Major Breakout — And It’s Not Bullish for Risk Assets
We’re approaching a critical breakout zone in bonds.
At first glance, you might think: “High demand for U.S. debt? That’s great! Higher bond prices, lower yields, cheaper interest payments!”
That’s Trump-math logic — the same kind that says prices are “down 300%.” 😅 You can only go down 100%, folks. No matter where the price goes!
Here’s the real story:
For bond prices to surge, investors must be running from risk. Big money
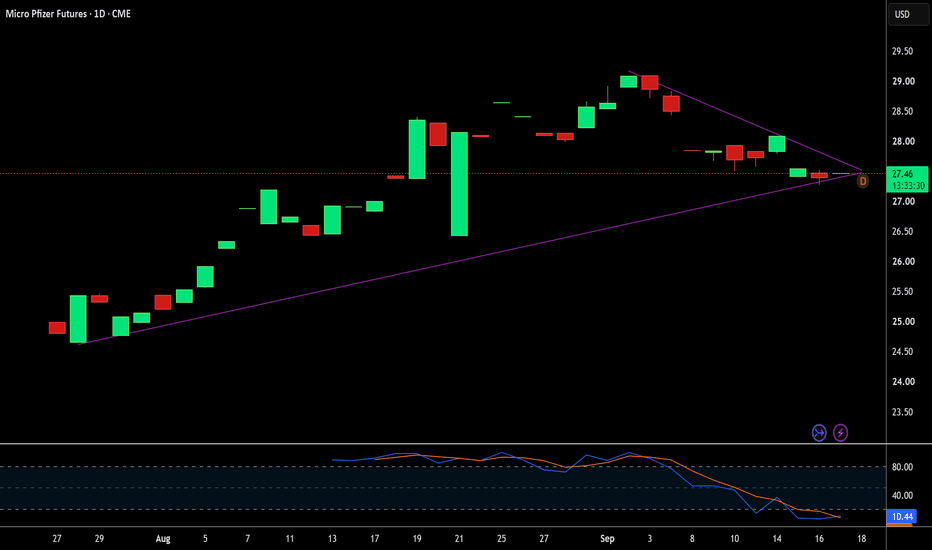
Can Pfizer Outrun Its Massive Post-COVID Patent Cliff?Pfizer stands at a strategic crossroads. COVID-19 demand has normalized hard. Comirnaty fell 34% operationally in Q2 2026, and Paxlovid fell 95%.
Non-COVID therapeutics now carry the enterprise. Excluding Comirnaty and Paxlovid, Q2 revenues grew 5% operationally. Launched and acquired products grew 18% operationally.
Pfizer raised 2026 revenue guidance by $500 million at the midpoint to $60.5 to $62.5 billion. The raise reflects roughly $1.5 billion of better-than-expected non-COVID performanc
Can the Australian Dollar Survive Fed Hikes?Macroeconomic Divergence
The Federal Reserve raised its target range to 3.75% to 4.00% on September 16, 2026. The vote was unanimous at 12-0. This was the first US rate increase since July 2023. Updated projections signal another hike may follow this year.
The move narrowed Australia’s yield advantage without erasing it. The RBA cash rate sits at 4.35%, still above the new US range. The Reserve Bank hiked three times earlier in 2026, then held in August. Markets now price roughly a 78% chanc
Free Markets Set Rates Not The FED!"Blame the FED" is such a bullscitt excuse for all political economic theories. It's the villain in their cute story where they are the hero.
In reality, it's the free markets that set rates, not the FED. The FED is always late to the party. This time was no different. The Fed raised .25 bp today. A surprise to no one who understands economics and finance.
What is a pleasant surprise is that the FED has not been taken over by Trumpchenko. This keeps the FED's independence & credibility intact.
Market Crash Explained – Why It Happens So FastA market crash rarely begins with one massive red candle.
Usually, it starts much more quietly: price begins to weaken, buyers lose momentum, and a key support level breaks. Then the market suddenly accelerates, and within a short period of time, concern turns into panic.
🔍 1. What Really Causes a Market Crash?
A market falls sharply when the number of people trying to sell far exceeds the number of buyers willing to step in at the current price.
The trigger can be a recession, financial
Will Record Copper Futures Trigger a Global Energy Crisis?Macroeconomics and Economic Realities
Copper futures recently hit historic highs across major global exchanges. COMEX contracts touched a record $6.894 per pound on September 10. London Metal Exchange three-month contracts reached a record $14,858.50 per metric ton the same morning. LME copper has climbed about 19% in 2026 and roughly 48% over twelve months. Hours after that peak, futures fell more than 4% on reports that Washington had not decided on refined copper tariffs. That reversal revea
What Peter Lynch Saw FirstPeter Lynch became one of the most respected investors of his generation by doing something that sounds simple but is extremely difficult: finding businesses that were worth more than the market believed. From 1977 to 1990, he managed the Fidelity Magellan Fund and generated an exceptional long-term return. His approach was not about predicting every market move or finding the next hot stock. It was about understanding businesses, identifying changes in their fundamentals, and recognizing when t