Long
Long
 Long
Long
 Long
Long
 Long
Long
 Short
Short
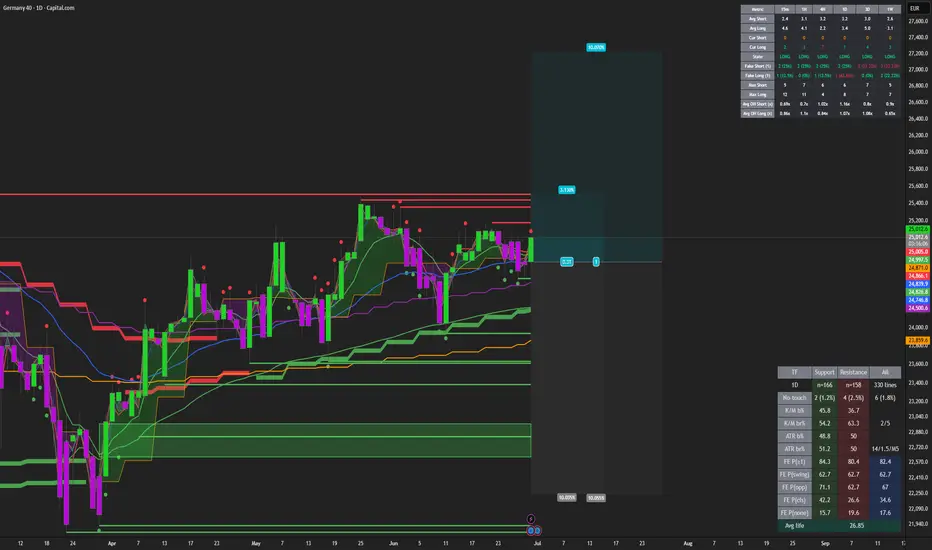
DAX (GER40) LONG — 1D ALMA Setup (WR 78%)█ SETUP
Germany 40 / DAX · CAPITALCOM:GER40 · 1D · long only.
(Context: XETR:DAX cash index for macro read.)
ALMA Averaging Strategy: ALMA 3 / σ2, SD band 2, min diff 1 bar to add / 4 bars to exit, 25% per bar, up to 4 adds, hard stop −10% from average entry.
Strategy Tester (GER40 1D):
Win rate 78% · profit factor 2.2 · max drawdown 75% (equity curve — slow index sleeve)
Avg winning trade +10.0% · avg losing trade −8.4%
Typical hold ~88 bars on winners · 160 trades in sample · patient DAX mean-reversion grid
Live track record (same template, Jun 2026):
Prior 1D cycle 9–22 Jun closed +2.3% on the same strategy — re-entry, not a new template.
═
█ WHY NOW
Sunday evening DAX daily bar — ALMA long fired 29 Jun 21:05 UTC on the FOREXCOM:GER40 print.
Fresh 1D entry ~ 24,730 — index mean-reversion into the European weekly open, not a breakout chase. First bar only (no live MTM in snapshot — index mark feed intermittent on GER40).
Hard stop zone −10% from fill ~ 22,257 . Exits follow Pine ALMA flip + min diff or the hard stop — no discretionary TP ladder.
═
█ MACRO
Asset: GER40 = German large-cap / export-heavy index — ECB path, EURUSD, and China demand matter as much as US tech beta.
Tape (late Jun): US indices held better than metals/crypto on several sessions; European cash can catch up on a soft-landing read if EUR stabilizes.
Calendar: Geopolitics and energy still the swing overlay — DAX industrials benefit from EUR weakness but suffer on global growth scares.
Execution is 1D ALMA mean-reversion on an index CFD, not a macro forecast.
═
█ OUTLOOK
Positive factors
- 78% WR · PF 2.2 · avg win +10.0% vs avg loss −8.4% — positive skew on a slow index TF
- Fresh 29 Jun 21:05Z daily entry — same template that closed +2.3% mid-June
- Min diff 1/4 — patient exit clock suits index grind vs 1/1 crypto sleeves
- Typical hold ~88 bars on winners — aligns with multi-week DAX swings, not day-trading noise
- Hard −10% stop caps nominal script risk per lot
Negative factors
- High equity-curve max DD in long backtest (index sleeves can sit underwater through cycles)
- First daily bar only — no confirmed follow-through beyond the ALMA entry print yet
- DAX gaps on EU headline risk (tariffs, ECB, Germany fiscal) — %-stop can slip on the cash open
- Index CFD spread / roll not in Pine tester
- Past backtest ≠ live fills
Takeaway: the 1D ALMA sleeve and mid-June +2.3% close on the same template support the Sunday refill, but elevated backtest drawdown and index gap risk make this a patient grind, not a momentum leg — min diff 1/4 exit clock and −10% hard stop bound nominal risk.
Base case: follow the 1D ALMA strategy · slow grind toward prior June exit zone (~25,080) if European risk appetite holds.
Bear case: global risk-off · DAX loses daily ALMA · −10% toward ~22,257 hard stop.
Educational idea. Live position — past backtest ≠ future results. NFA.  Long
Long
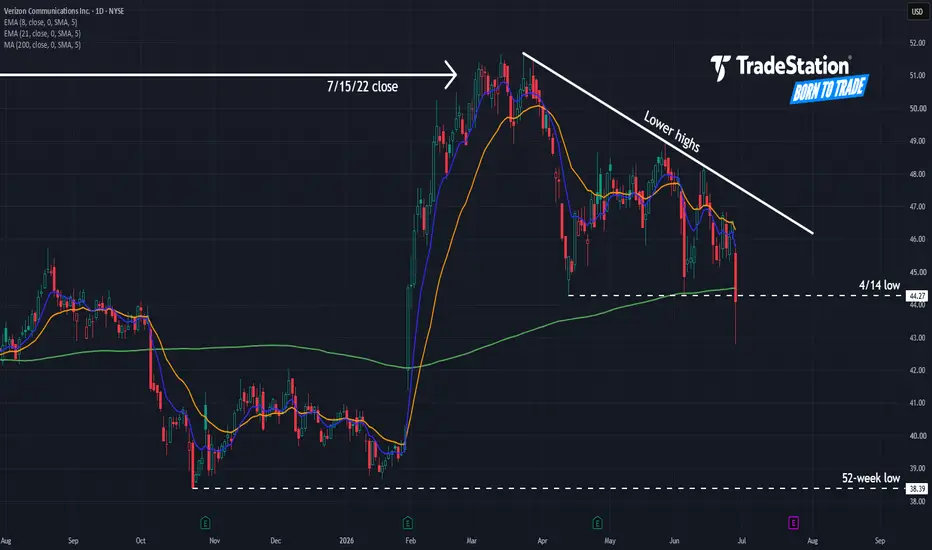
Verizon Could Be SlidingVerizon Communications has been sliding, and some traders may see risk of further downside.
The first pattern on today’s chart is a high around $51 from July 2022. VZ stalled at that level in March before rolling over, which may suggest that long-term resistance is in place.
Second, the telecom made lower highs following that peak. It tried to hold the April 14 low, but broke that level on Monday after being removed from the Dow Jones Industrial Average.
Third, prices closed under the 200-day simple moving average. That could be consistent with a longer-term breakdown.
Fourth, the 8-day exponential moving average (EMA) is under the 21-day EMA. That may reflect a short-term downtrend.
Finally, could traders look for a test of the 52-week low of $38.39?
TradeStation has, for decades, advanced the trading industry, providing access to stocks, options and futures. If you're born to trade, we could be for you. Learn more here about TradingView’s Broker of the Year!
Past performance, whether actual or indicated by historical tests of strategies, is no guarantee of future performance or success. There is a possibility that you may sustain a loss equal to or greater than your entire investment regardless of which asset class you trade (equities, options or futures); therefore, you should not invest or risk money that you cannot afford to lose. Online trading is not suitable for all investors. View the document titled Characteristics and Risks of Standardized Options at www.TradeStation.com . Before trading any asset class, customers must read the relevant risk disclosure statements on www.TradeStation.com . System access and trade placement and execution may be delayed or fail due to market volatility and volume, quote delays, system and software errors, Internet traffic, outages and other factors.
Securities and futures trading is offered to self-directed customers by TradeStation Securities, Inc., a broker-dealer registered with the Securities and Exchange Commission and a futures commission merchant licensed with the Commodity Futures Trading Commission). TradeStation Securities is a member of the Financial Industry Regulatory Authority, the National Futures Association, and a number of exchanges.
TradeStation Securities, Inc. and TradeStation Technologies, Inc. are each wholly owned subsidiaries of TradeStation Group, Inc., both operating, and providing products and services, under the TradeStation brand and trademark. When applying for, or purchasing, accounts, subscriptions, products and services, it is important that you know which company you will be dealing with. Visit www.TradeStation.com for further important information explaining what this means.  Long
Long
 Long
Long
 Long
Long
 Long
Long
 Long
Long

 Long
Long
 Long
Long
 Long
Long

Amgen Bases as Healthcare RampsHealth care stocks have been coming to life, and some traders may see an opportunity in drugmaker Amgen.
The first pattern on today’s chart is the basing pattern between $320 and $330. It also occurred along the 200-day simple moving average (SMA), which could be consistent with a longer-term uptrend.
Second, prices spent more than two months below the 50-day SMA but are now back above it. Is intermediate-term momentum improving?
Third, the 8-day exponential moving average (EMA) is above the 21-day EMA and MACD is rising. Those signals may reflect short-term bullishness.
Fourth, the April 9 close of $355.60 acted as a ceiling for more than two months, but last week AMGN closed above it.
TradeStation has, for decades, advanced the trading industry, providing access to stocks, options and futures. If you're born to trade, we could be for you. Learn more here about TradingView’s Broker of the Year!
Past performance, whether actual or indicated by historical tests of strategies, is no guarantee of future performance or success. There is a possibility that you may sustain a loss equal to or greater than your entire investment regardless of which asset class you trade (equities, options or futures); therefore, you should not invest or risk money that you cannot afford to lose. Online trading is not suitable for all investors. View the document titled Characteristics and Risks of Standardized Options at www.TradeStation.com . Before trading any asset class, customers must read the relevant risk disclosure statements on www.TradeStation.com . System access and trade placement and execution may be delayed or fail due to market volatility and volume, quote delays, system and software errors, Internet traffic, outages and other factors.
Securities and futures trading is offered to self-directed customers by TradeStation Securities, Inc., a broker-dealer registered with the Securities and Exchange Commission and a futures commission merchant licensed with the Commodity Futures Trading Commission). TradeStation Securities is a member of the Financial Industry Regulatory Authority, the National Futures Association, and a number of exchanges.
TradeStation Securities, Inc. and TradeStation Technologies, Inc. are each wholly owned subsidiaries of TradeStation Group, Inc., both operating, and providing products and services, under the TradeStation brand and trademark. When applying for, or purchasing, accounts, subscriptions, products and services, it is important that you know which company you will be dealing with. Visit www.TradeStation.com for further important information explaining what this means.  Long
Long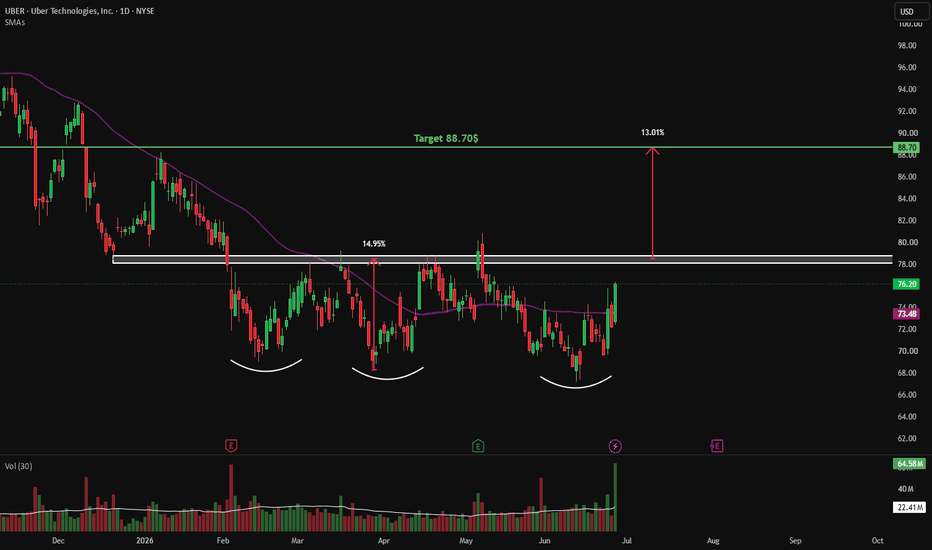
 Long
Long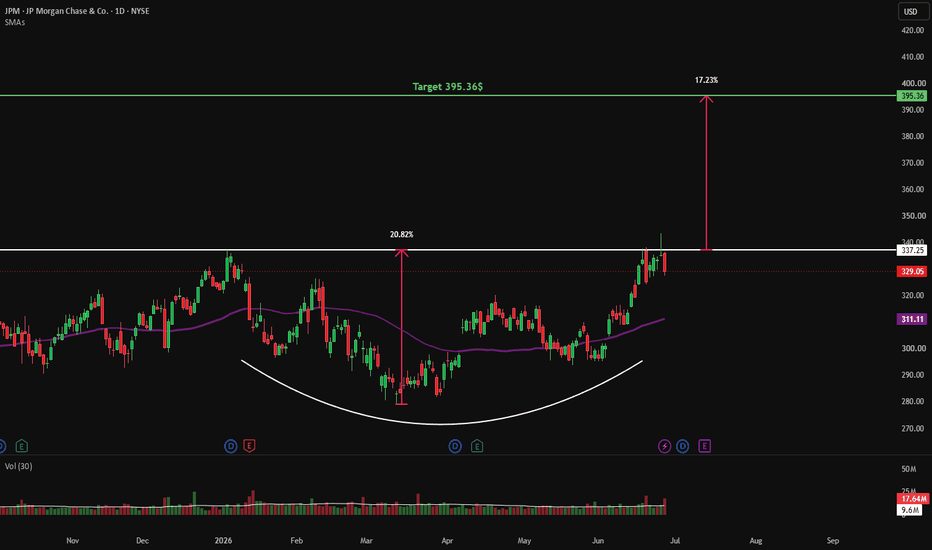
 Short
Short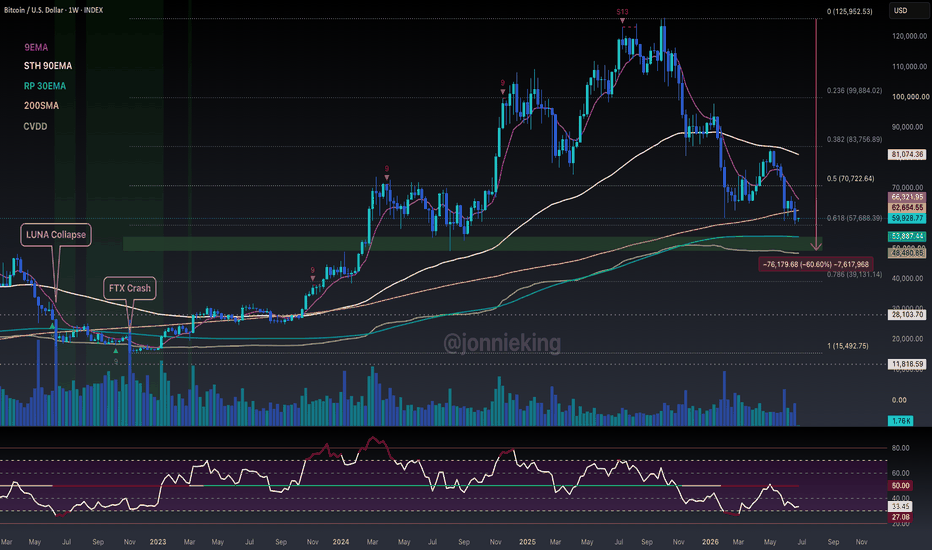
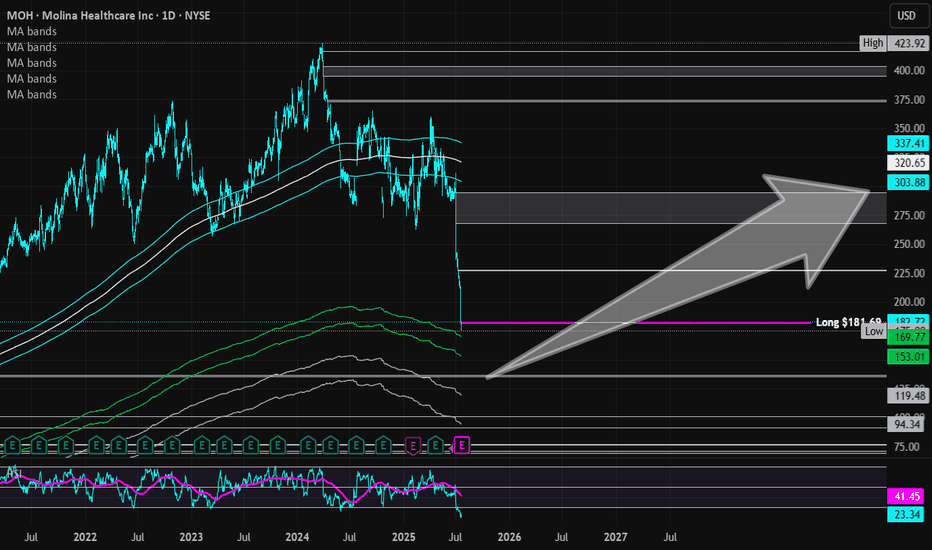
Molina Healthcare | MOH | Long at $181.69Healthcare providers and services are at a major discount right now: and may be discounted even more this year. I am personally buying and long-term holding the fear, knowing the baby boom generation is going to utilize our healthcare system at a rate unseen in modern times. While the price discounts are valid "right now" given the current political administration's cuts, long-term it is far from valid... The strategy I am using with healthcare stocks ( NYSE:MOH , NYSE:CNC , NYSE:UNH , NYSE:ELV , etc) is cost averaging: not buying one single large position in an effort to predict bottom but buying smaller positions over time to create a cost average "near" bottom. If you are a day trader or want a quick swing in healthcare, I don't think it's going to happen for a bit. But those not entering in the coming months / year will likely miss out on a very large healthcare boom - especially when AI truly enters the picture in this sector...
Fundamentally, Molina Healthcare NYSE:MOH is a very strong company. Low debt-to-equity (.9x), P/E of 8.8x, quick ratio of 1.7x, $41 billion in revenue in 2024. Yes, there will be issues in the near-term due to Medicaid and other funding cuts. But long-term, this sector is primed to benefit from an aging population.
So, while NYSE:MOH is in a personal buy zone at $181.69, I don't think this is necessarily bottom. I anticipate this stock to drop even further, eventually closing the daily price gap at $135.00. My next buys are in the $150's and $130's, thus cost averaging into a larger position. For true value investors, those prices and anything below is a steal. Today's negative healthcare sector noise is loud, but it does not represent the future.
Targets into 2028:
$226.00 (+24.3%)
$290.00 (+59.6%)
 Long
Long