Moving Averages
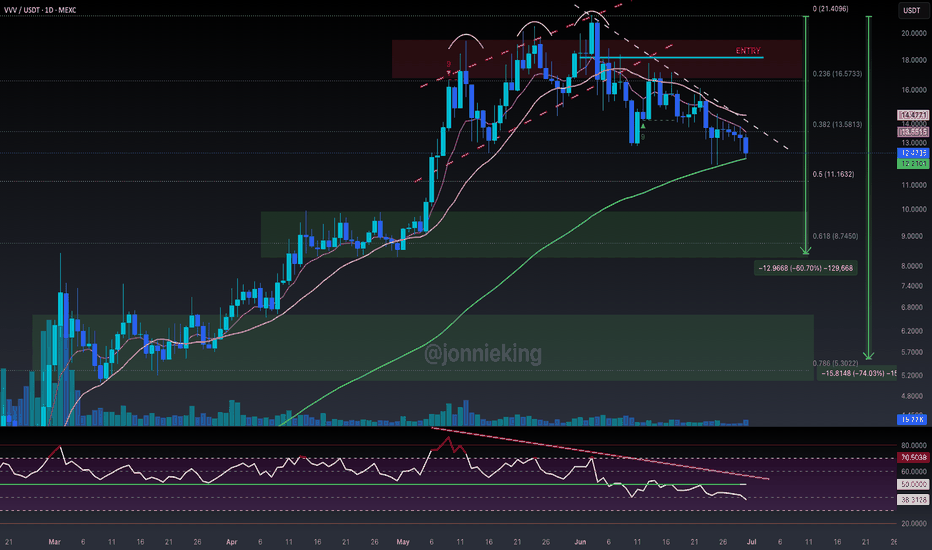
$VVV Bears in Full Control Updated Analysis + Targets For ShortsHad a few rough trades a few months ago which forced me to reevaluate my trading setups entirely, and I gotta say it was probably one of the best things that could have happened to me.
My new strategy has been absolute fire lately.
Case in point, this NYSE:VVV SHORT.
Nailed the entry earlier in the month, and been riding it ever since. Notice how PA just keeps getting pushed down by the 9EMA and 20MA.
The RSI Bearish Divergence on Venice Token has been blatantly obvious for sometime now.
PA currently at the 100MA but looks like it wants to melt through.
We could see a small bounce before testing the 50% Gann.
That’s the line in the sand for bulls. If that doesnt hold, next target is ~$8.50… If that doesn’t hold, ~$5.50 next.
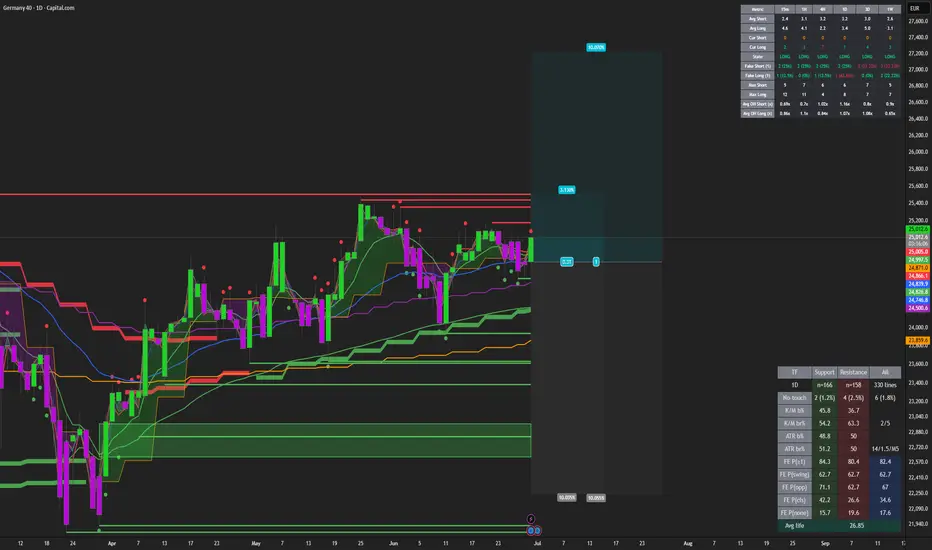
DAX (GER40) LONG — 1D ALMA Setup (WR 78%)█ SETUP
Germany 40 / DAX · CAPITALCOM:GER40 · 1D · long only.
(Context: XETR:DAX cash index for macro read.)
ALMA Averaging Strategy: ALMA 3 / σ2, SD band 2, min diff 1 bar to add / 4 bars to exit, 25% per bar, up to 4 adds, hard stop −10% from average entry.
Strategy Tester (GER40 1D):
Win rate 78% · profit factor 2.2 · max drawdown 75% (equity curve — slow index sleeve)
Avg winning trade +10.0% · avg losing trade −8.4%
Typical hold ~88 bars on winners · 160 trades in sample · patient DAX mean-reversion grid
Live track record (same template, Jun 2026):
Prior 1D cycle 9–22 Jun closed +2.3% on the same strategy — re-entry, not a new template.
═
█ WHY NOW
Sunday evening DAX daily bar — ALMA long fired 29 Jun 21:05 UTC on the FOREXCOM:GER40 print.
Fresh 1D entry ~ 24,730 — index mean-reversion into the European weekly open, not a breakout chase. First bar only (no live MTM in snapshot — index mark feed intermittent on GER40).
Hard stop zone −10% from fill ~ 22,257 . Exits follow Pine ALMA flip + min diff or the hard stop — no discretionary TP ladder.
═
█ MACRO
Asset: GER40 = German large-cap / export-heavy index — ECB path, EURUSD, and China demand matter as much as US tech beta.
Tape (late Jun): US indices held better than metals/crypto on several sessions; European cash can catch up on a soft-landing read if EUR stabilizes.
Calendar: Geopolitics and energy still the swing overlay — DAX industrials benefit from EUR weakness but suffer on global growth scares.
Execution is 1D ALMA mean-reversion on an index CFD, not a macro forecast.
═
█ OUTLOOK
Positive factors
- 78% WR · PF 2.2 · avg win +10.0% vs avg loss −8.4% — positive skew on a slow index TF
- Fresh 29 Jun 21:05Z daily entry — same template that closed +2.3% mid-June
- Min diff 1/4 — patient exit clock suits index grind vs 1/1 crypto sleeves
- Typical hold ~88 bars on winners — aligns with multi-week DAX swings, not day-trading noise
- Hard −10% stop caps nominal script risk per lot
Negative factors
- High equity-curve max DD in long backtest (index sleeves can sit underwater through cycles)
- First daily bar only — no confirmed follow-through beyond the ALMA entry print yet
- DAX gaps on EU headline risk (tariffs, ECB, Germany fiscal) — %-stop can slip on the cash open
- Index CFD spread / roll not in Pine tester
- Past backtest ≠ live fills
Takeaway: the 1D ALMA sleeve and mid-June +2.3% close on the same template support the Sunday refill, but elevated backtest drawdown and index gap risk make this a patient grind, not a momentum leg — min diff 1/4 exit clock and −10% hard stop bound nominal risk.
Base case: follow the 1D ALMA strategy · slow grind toward prior June exit zone (~25,080) if European risk appetite holds.
Bear case: global risk-off · DAX loses daily ALMA · −10% toward ~22,257 hard stop.
Educational idea. Live position — past backtest ≠ future results. NFA.
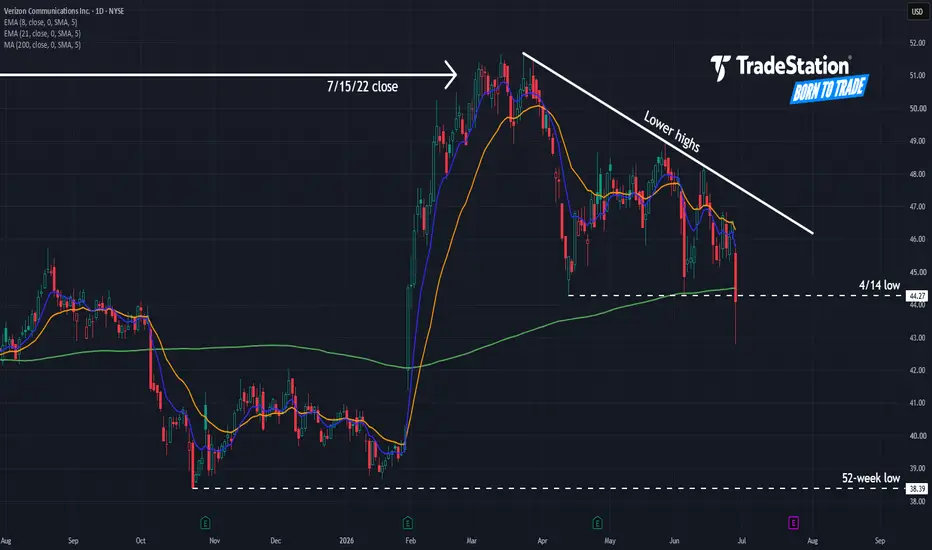
Verizon Could Be SlidingVerizon Communications has been sliding, and some traders may see risk of further downside.
The first pattern on today’s chart is a high around $51 from July 2022. VZ stalled at that level in March before rolling over, which may suggest that long-term resistance is in place.
Second, the telecom made lower highs following that peak. It tried to hold the April 14 low, but broke that level on Monday after being removed from the Dow Jones Industrial Average.
Third, prices closed under the 200-day simple moving average. That could be consistent with a longer-term breakdown.
Fourth, the 8-day exponential moving average (EMA) is under the 21-day EMA. That may reflect a short-term downtrend.
Finally, could traders look for a test of the 52-week low of $38.39?
TradeStation has, for decades, advanced the trading industry, providing access to stocks, options and futures. If you're born to trade, we could be for you. Learn more here about TradingView’s Broker of the Year!
Past performance, whether actual or indicated by historical tests of strategies, is no guarantee of future performance or success. There is a possibility that you may sustain a loss equal to or greater than your entire investment regardless of which asset class you trade (equities, options or futures); therefore, you should not invest or risk money that you cannot afford to lose. Online trading is not suitable for all investors. View the document titled Characteristics and Risks of Standardized Options at www.TradeStation.com . Before trading any asset class, customers must read the relevant risk disclosure statements on www.TradeStation.com . System access and trade placement and execution may be delayed or fail due to market volatility and volume, quote delays, system and software errors, Internet traffic, outages and other factors.
Securities and futures trading is offered to self-directed customers by TradeStation Securities, Inc., a broker-dealer registered with the Securities and Exchange Commission and a futures commission merchant licensed with the Commodity Futures Trading Commission). TradeStation Securities is a member of the Financial Industry Regulatory Authority, the National Futures Association, and a number of exchanges.
TradeStation Securities, Inc. and TradeStation Technologies, Inc. are each wholly owned subsidiaries of TradeStation Group, Inc., both operating, and providing products and services, under the TradeStation brand and trademark. When applying for, or purchasing, accounts, subscriptions, products and services, it is important that you know which company you will be dealing with. Visit www.TradeStation.com for further important information explaining what this means.
$RYAN - 50 SMA Breakout and Bowl Pattern💡 Swing setup idea
Bowl pattern completion
🔎 Analysis summary:
The stock crossed above the 50 SMA and is closing a bowl structure. We are also seeing buyers volume stepping in to support the move.
👀 Levels to watch:
Entry trigger: Break above $38.88
Target: $48.07
Stop: Under the breakout level
💬 What do you think of this setup? Let me know in the comments! 👇
Good luck!
⚠️ Note: This is for educational purposes only and is not financial advice.
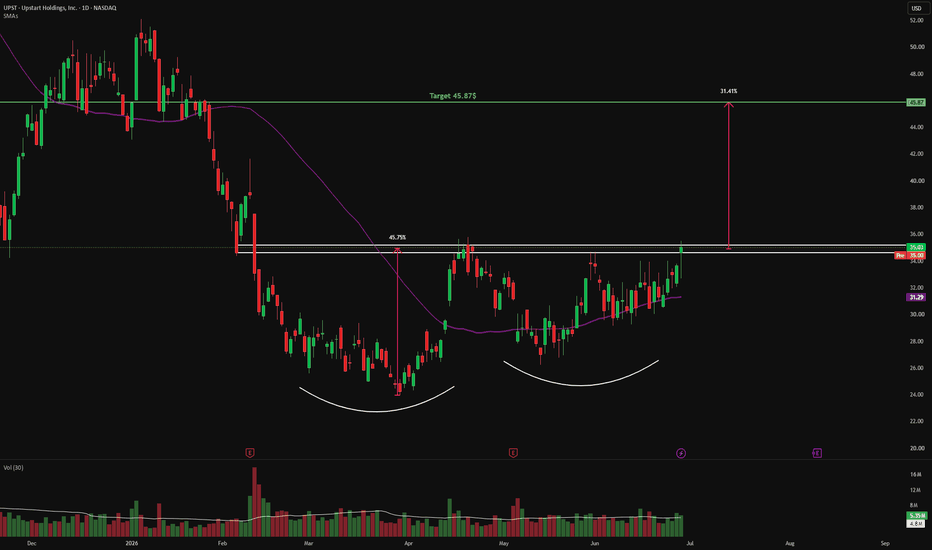
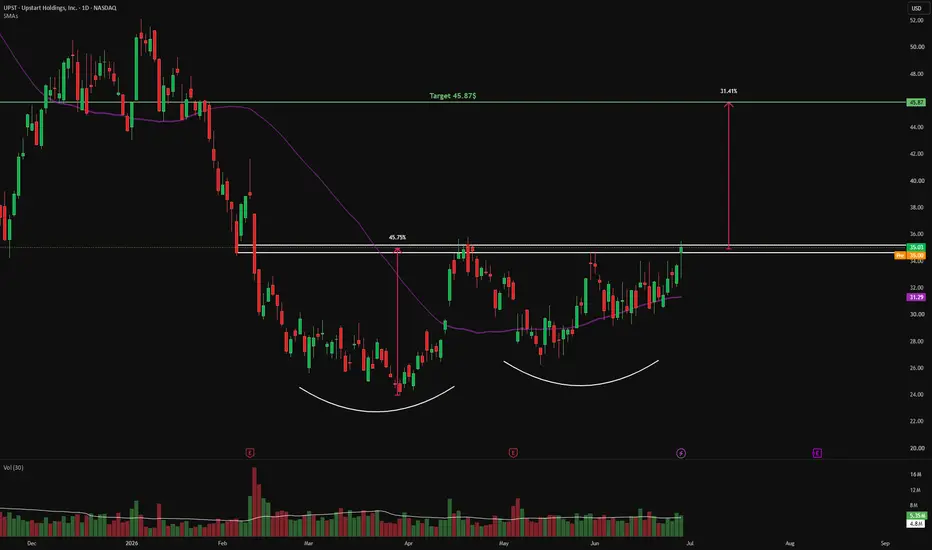
$UPST - 50 SMA Breakout and Cup and Handle Pattern💡 Swing setup idea
Cup and handle completion
🔎 Analysis summary:
The stock is crossing above the 50 SMA and closing a cup and handle pattern. We are seeing above-average buyers volume stepping in to support the move.
👀 Levels to watch:
Entry trigger: Break above $35.19
Target: $45.87
Stop: Under the breakout level
💬 What do you think of this setup? Let me know in the comments! 👇
Good luck!
⚠️ Note: This is for educational purposes only and is not financial advice.
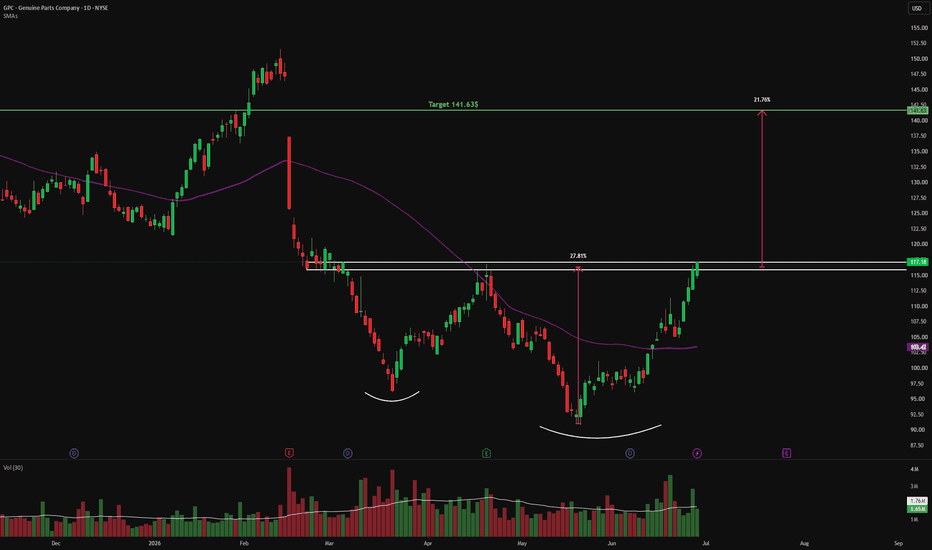
$GPC - 50 SMA Breakout and Double Bottom Pattern💡 Swing setup idea
Double bottom completion
🔎 Analysis summary:
The stock crossed above the 50 SMA and is closing a double bottom pattern. We are also seeing strong buyers volume stepping in to support the move.
👀 Levels to watch:
Entry trigger: Break above $117.11
Target: $141.63
Stop: Under the breakout level
💬 What do you think of this setup? Let me know in the comments! 👇
Good luck!
⚠️ Note: This is for educational purposes only and is not financial advice.
ABCL1W: turning around or just another biotech placeboABCL returns to key weekly support and prepares for the next move
ABCL has tested the strong weekly support zone between 3.48 and 3.98. This area combines Fibonacci retracement levels, a previous breakout retest and an important signal with ma50 crossing above ma100. Such a combination often forms a reliable accumulation zone. Buyers reacted immediately from this region which confirms active demand. The nearest key resistance is located near 6.05. A confident close above this level opens the path toward the next target at 8.00.
AbCellera operates in the biotechnology sector and develops advanced antibody discovery platforms for pharmaceutical partners. Revenue remains uneven due to milestone based payments. However the company maintains a strong balance sheet, significant cash reserves and a growing number of active programs. Improving sentiment in the biotech sector enhances the fundamental backdrop.
As long as price remains above the 3.48 to 3.98 area, the structure retains the signs of a forming medium term base. If this zone is lost, the market may shift into wide consolidation. The present reaction suggests that buyers are defending the level with confidence.
Support levels often speak louder than headlines. The chart usually warns long before the news arrives.
GOOG 400c Sept or JanGoogle has bounced off the Weekly 20ma and now has resumed it's upward trajectory. It's currently at a Prev. ATH and might run into resistance here but right above has a gap that it has filled but will also be a testing area for it as well.
50ema and 20ma serve as immediate overhead resistance but once pushed above, I can see this going back to all time highs rather fast .
With July being a strong month for QQQ I can see this being the last push before we reach midterms.
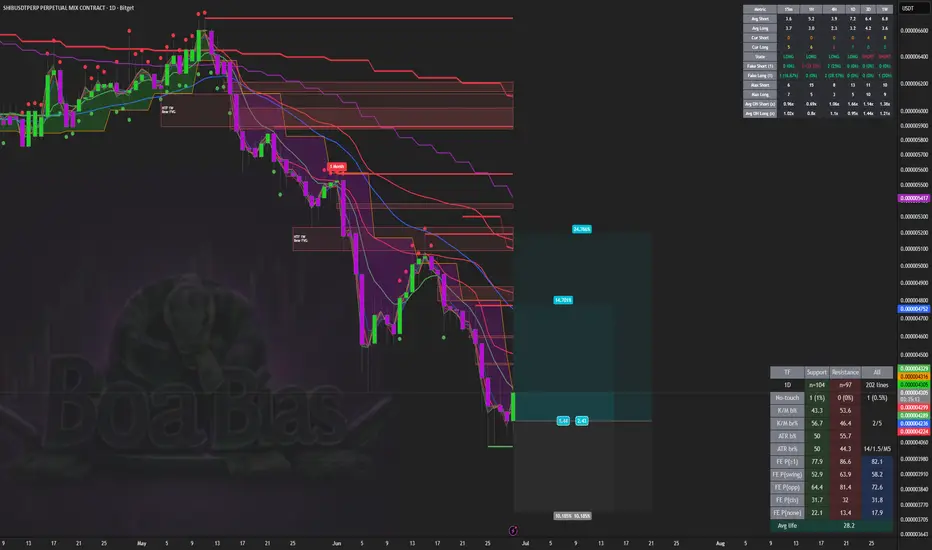
SHIB LONG — 1D ALMA Setup (WR 85%)█ SETUP
Shiba Inu perp · BITGET:SHIBUSDT.P · 1D · long only.
ALMA Averaging Strategy: ALMA 3 / σ2, SD band 2, min diff 6 bar to add / 1 bar to exit, 25% per bar, up to 4 adds, hard stop −10% from average entry.
Strategy Tester (SHIB 1D):
Win rate 85% · profit factor 6.3 · max drawdown 6%
Avg winning trade +17.0% · avg losing trade −7.9%
Typical hold ~16 bars on winners · 39 trades in sample
Meme-beta sleeve — high WR with winners more than 2× typical loss size
═
█ WHY NOW
Sunday midnight daily bar — fresh 1D ALMA long at 29 Jun 00:00 UTC ~ 0.000004163 on the 85% WR template.
This is a daily mean-reversion add into the meme complex after a waterfall June — not a social-headline chase. Mark since entry ~ +3.7% (early green MTM).
Hard stop zone −10% from fill ~ 0.000003747 . Exits follow Pine ALMA rules or the hard stop — no discretionary TP ladder.
═
█ MACRO
Crypto tape: BTC range-bound into the week — alt memes can outperform on short squeezes when BTC holds, but bleed faster on risk-off days.
Meme sector: SHIB trades as high-beta social liquidity — flows follow BTC stability and retail risk appetite more than fundamentals.
Context: Geopolitical headline week (oil / macro) kept crypto volatile — daily ALMA entries aim for bar-close discipline, not prediction of the next viral catalyst.
Execution is 1D ALMA, not a token roadmap call.
═
█ OUTLOOK
Positive factors
- 85% WR · PF 6.3 · avg win +17.0% vs avg loss −7.9% · ~16 bars — strong tester skew for a meme pair
- Fresh 29 Jun 00:00Z daily entry · early MTM positive
- Daily TF = slower bar clock vs 4H/12H meme scalps — fewer whipsaw exits if BTC range holds
- Hard −10% stop caps nominal script risk per lot
- High avg win vs avg loss supports holding rule exits rather than manual panic on first red day
Negative factors
- Meme beta — correlation to BTC risk-off days remains high; daily bar can gap through a %-stop
- Social/narrative risk: sentiment can flip intraday without a chart signal
- Single-lot start — add grid may engage lower if discount extends
- Past backtest ≠ live perp fills (funding, wick risk on BITGET)
Base case: daily ALMA holds · BTC stable · slow grind toward next ALMA target band if meme complex stays bid.
Bear case: BTC risk-off gap · lose daily ALMA · −10% hard stop toward ~0.00000375.
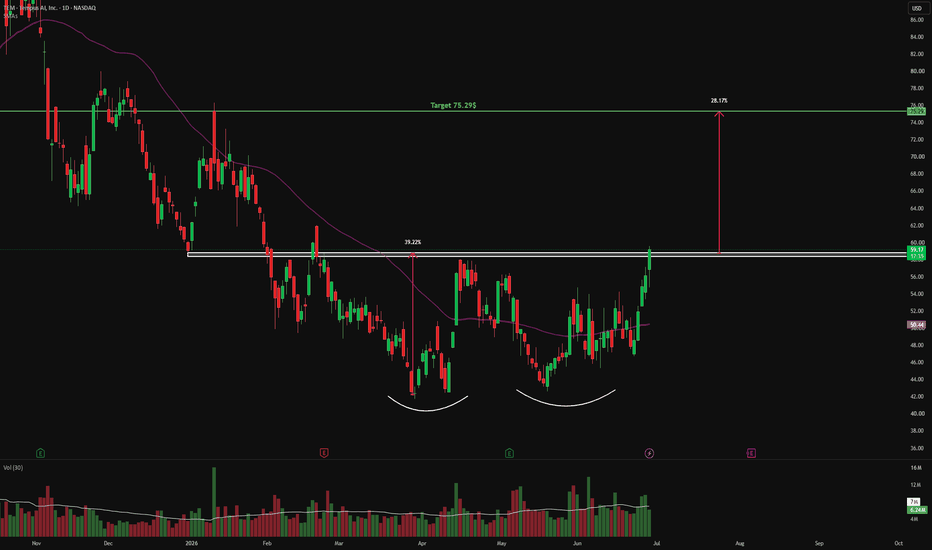
$TEM - 50 SMA Breakout and Double Bottom Pattern💡 Swing setup idea
Double bottom completion
🔎 Analysis summary:
The stock crossed above the 50 SMA and is closing a double bottom pattern. We are also seeing above-average buyers volume stepping in to support the move.
👀 Levels to watch:
Entry trigger: Break above $58.80
Target: $75.29
Stop: Under the breakout level
💬 What do you think of this setup? Let me know in the comments! 👇
Good luck!
⚠️ Note: This is for educational purposes only and is not financial advice.
Amgen Bases as Healthcare RampsHealth care stocks have been coming to life, and some traders may see an opportunity in drugmaker Amgen.
The first pattern on today’s chart is the basing pattern between $320 and $330. It also occurred along the 200-day simple moving average (SMA), which could be consistent with a longer-term uptrend.
Second, prices spent more than two months below the 50-day SMA but are now back above it. Is intermediate-term momentum improving?
Third, the 8-day exponential moving average (EMA) is above the 21-day EMA and MACD is rising. Those signals may reflect short-term bullishness.
Fourth, the April 9 close of $355.60 acted as a ceiling for more than two months, but last week AMGN closed above it.
TradeStation has, for decades, advanced the trading industry, providing access to stocks, options and futures. If you're born to trade, we could be for you. Learn more here about TradingView’s Broker of the Year!
Past performance, whether actual or indicated by historical tests of strategies, is no guarantee of future performance or success. There is a possibility that you may sustain a loss equal to or greater than your entire investment regardless of which asset class you trade (equities, options or futures); therefore, you should not invest or risk money that you cannot afford to lose. Online trading is not suitable for all investors. View the document titled Characteristics and Risks of Standardized Options at www.TradeStation.com . Before trading any asset class, customers must read the relevant risk disclosure statements on www.TradeStation.com . System access and trade placement and execution may be delayed or fail due to market volatility and volume, quote delays, system and software errors, Internet traffic, outages and other factors.
Securities and futures trading is offered to self-directed customers by TradeStation Securities, Inc., a broker-dealer registered with the Securities and Exchange Commission and a futures commission merchant licensed with the Commodity Futures Trading Commission). TradeStation Securities is a member of the Financial Industry Regulatory Authority, the National Futures Association, and a number of exchanges.
TradeStation Securities, Inc. and TradeStation Technologies, Inc. are each wholly owned subsidiaries of TradeStation Group, Inc., both operating, and providing products and services, under the TradeStation brand and trademark. When applying for, or purchasing, accounts, subscriptions, products and services, it is important that you know which company you will be dealing with. Visit www.TradeStation.com for further important information explaining what this means.
NVIDIA ($NVDA) Daily: Price Approaches Institutional 200 EMANVIDIA ( NASDAQ:NVDA ) Daily: Price Approaches Institutional 200 EMA – Monitoring Golden Ratio Pocket for High-Asymmetry Bullish Pivot
### 🇺🇸 NVIDIA Corporation ( NASDAQ:NVDA - NASDAQ) Daily Technical Study (Ref: NVDA_2026-06-29_11-57-58.png)
We are deploying a comprehensive macro-structural analysis on NVIDIA Corporation ( NASDAQ:NVDA ) on the Daily (1D) matrix. As the broader technology sector undergoes a healthy liquidity reset, NVDA is rotating into a highly significant long-term institutional demand pocket.
The asset is experiencing localized selling pressure, trading down **-1.64% at $192.53**, following a structural breakdown below intermediate baselines.
---
### 🔍 Technical Invalidation & The Descent Continuum:
1. **The 72 SMA Breach:** The near-term trend filter underwent a bearish shift as price action fatiated through the **72-period SMA (orange line at $200.79)** and the 0.50 Fibonacci retracement coordinate at **$200.64**.
2. **The Golden Ratio Test:** The decline has brought the stock directly into the key **0.618 Fibonacci retracement baseline locked at $192.18**. While the Golden Ratio represents a strong technical node, we must note the critical proximity of the long-term anchor below.
---
### 🎯 The Tactical Target Matrix: Waiting for the 200 EMA Pivot
Our framework avoids catching falling knives. Instead, we are exercising patience and mapping out a strict institutional execution plan:
* **The 200 EMA Dynamic Floor:** Sitting immediately below current prices is the dominant institutional **200-period EMA (purple line at $188.62)**. This coordinate represents the primary line of defense for the macro bull market.
* **The Structural Setup (Blue Vector):** We are strictly monitoring the price action as it fills the **$188.00 – $192.00** confluence pocket. We are waiting for the price to touch or sweep this 200 EMA cluster and subsequently deliver a clean **bullish trend pivot** (higher highs and higher lows on lower timeframes or a definitive daily reversal signature).
### Strategic Summary:
The **$188 – $192** area constitutes a prime "Institutional Discount Zone." Once a clear accumulation footprint or dynamic pivot pattern materializes off the 200 EMA floor (modeled by our blue upward arrow), it will trigger a high-asymmetry long setup. Initial upside price targets focus on reclaiming the **72 SMA ($200.79)**, followed by extensions toward the **0.382 Fibonacci node ($209.10)** and the major static horizontal resistance line at **$212.99**.
---
📊 **ChartPro Data**
*Semiconductor Equity Architecture, Macro Mean-Reversion & Fibonacci Pivot Sourcing.*
⚠️ **Disclaimer:** For educational and informational purposes only. This technical framework represents a personal trading model and does not constitute financial or investment advice.
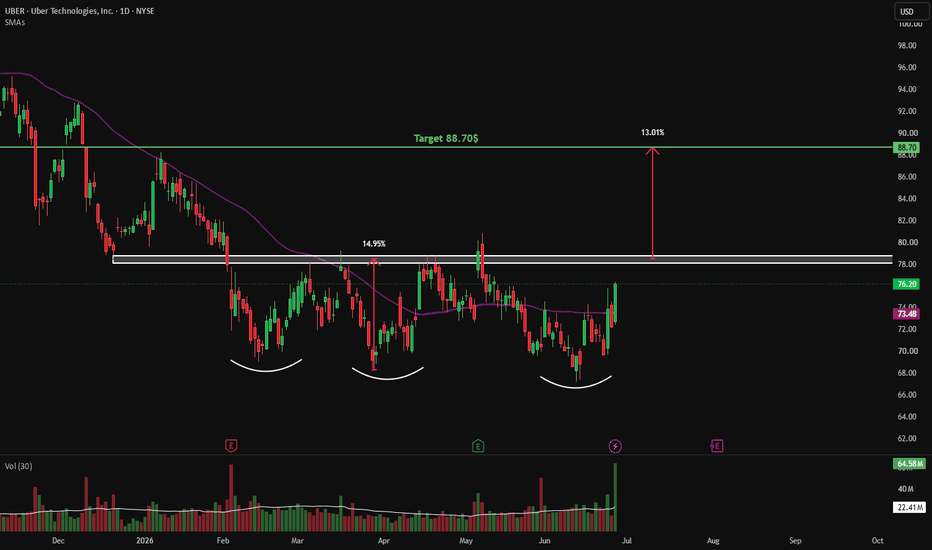
$UBER - Triple Bottom and 50 SMA Cross💡 Swing setup idea
Watchlist setup
🔎 Analysis summary:
Another great, high potential watchlist setup for the week. The stock crossed above the 50 SMA and is currently making a triple bottom pattern.
👀 Levels to watch:
Entry trigger: Break above $78.76
Target: $88.70
Stop: Under the breakout level
💬 What do you think of this setup? Let me know in the comments! 👇
Good luck!
⚠️ Note: This is for educational purposes only and is not financial advice.
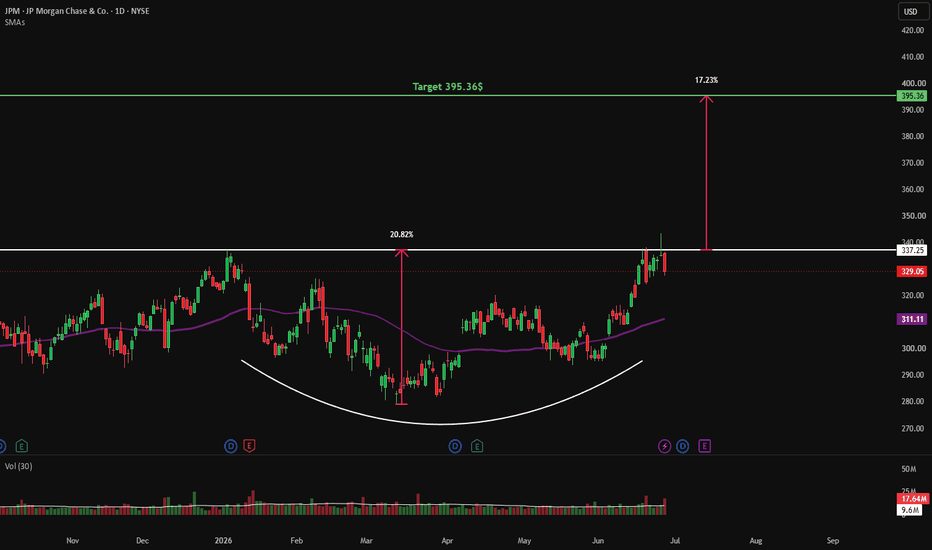
$JPM - 50 SMA Cross and Cup Structure💡 Swing setup idea
Watchlist setup
🔎 Analysis summary:
The stock crossed above the 50 SMA and closed a cup structure. This is a great setup to add to your watchlist and keep an eye on for a potential breakout.
👀 Levels to watch:
Entry trigger: Break above $337.25
Target: $395.36
Stop: Under the breakout level
💬 What do you think of this setup? Let me know in the comments! 👇
Good luck!
⚠️ Note: This is for educational purposes only and is not financial advice.
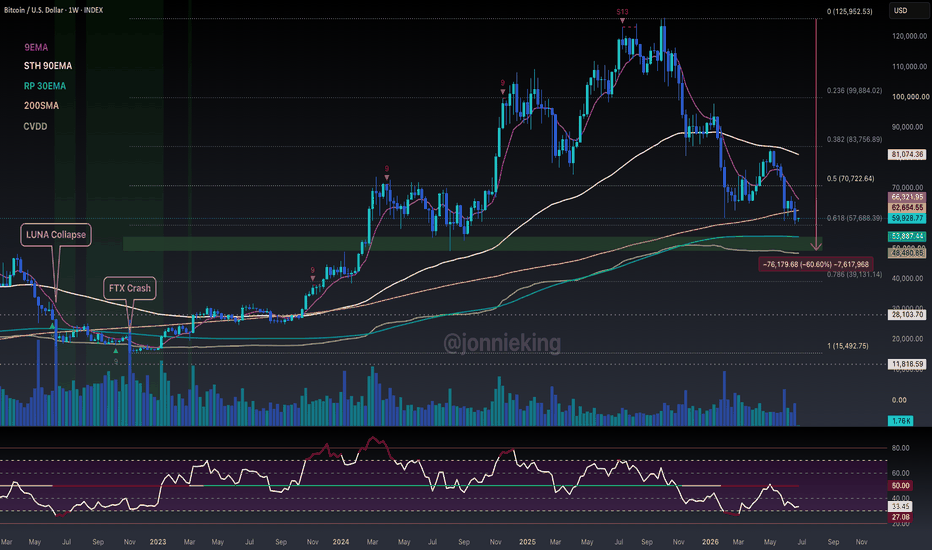
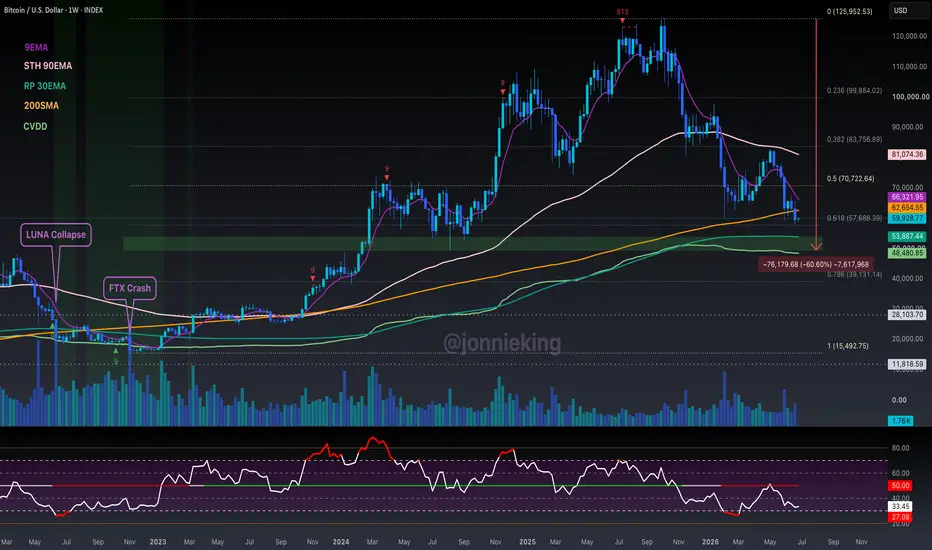
$BTC 1st Weekly Close below 200MA since Aug ’23 - What's Next?CRYPTOCAP:BTC has its first Weekly Close below the 200MA since Aug ’23.
If PA stays below for a couple more weeks, expect much more pain to come.
9EMA should cross under the 200MA within the next month for the first time since August ’22, which was shortly after the LUNA collapse.
Next up Bitcoin will visit $54k (RP) then most likely $48k (CVDD).
Hopefully that marks the bottom.
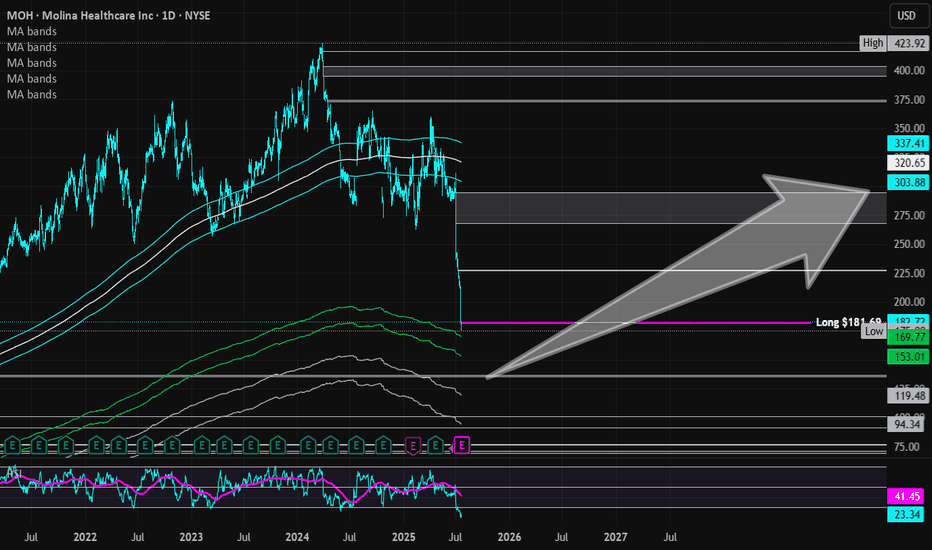
Molina Healthcare | MOH | Long at $181.69Healthcare providers and services are at a major discount right now: and may be discounted even more this year. I am personally buying and long-term holding the fear, knowing the baby boom generation is going to utilize our healthcare system at a rate unseen in modern times. While the price discounts are valid "right now" given the current political administration's cuts, long-term it is far from valid... The strategy I am using with healthcare stocks ( NYSE:MOH , NYSE:CNC , NYSE:UNH , NYSE:ELV , etc) is cost averaging: not buying one single large position in an effort to predict bottom but buying smaller positions over time to create a cost average "near" bottom. If you are a day trader or want a quick swing in healthcare, I don't think it's going to happen for a bit. But those not entering in the coming months / year will likely miss out on a very large healthcare boom - especially when AI truly enters the picture in this sector...
Fundamentally, Molina Healthcare NYSE:MOH is a very strong company. Low debt-to-equity (.9x), P/E of 8.8x, quick ratio of 1.7x, $41 billion in revenue in 2024. Yes, there will be issues in the near-term due to Medicaid and other funding cuts. But long-term, this sector is primed to benefit from an aging population.
So, while NYSE:MOH is in a personal buy zone at $181.69, I don't think this is necessarily bottom. I anticipate this stock to drop even further, eventually closing the daily price gap at $135.00. My next buys are in the $150's and $130's, thus cost averaging into a larger position. For true value investors, those prices and anything below is a steal. Today's negative healthcare sector noise is loud, but it does not represent the future.
Targets into 2028:
$226.00 (+24.3%)
$290.00 (+59.6%)
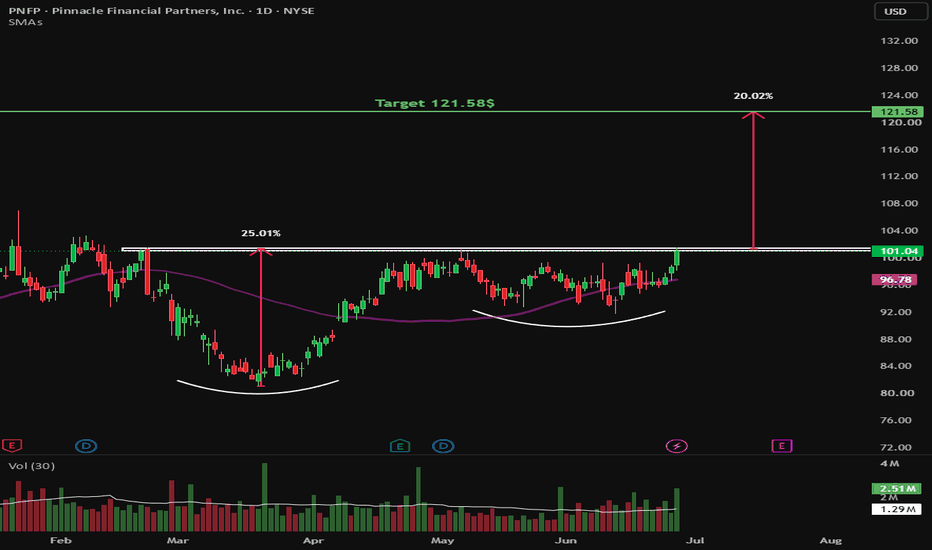
$PNFP - Big Cup and Handle and 50 SMA Breakout💡 Swing setup idea
Bullish breakout
🔎 Analysis summary:
The stock crossed above the 50 SMA, closing a big cup and handle pattern. Buyers' volume is stepping in, showing strong momentum supporting the move.
🔔 Friendly reminder: The broader market is currently trending down, so please keep market weakness in mind before entering any new trades.
👀 Levels to watch:
Entry trigger: Break above $101.41
Target: $121.58
Stop: Under the breakout level
💬 What do you think of this setup? Let me know in the comments! 👇
Good luck!
⚠️ Note: This is for educational purposes only and is not financial advice.
$OMF - Double Bottom and 50 SMA Breakout💡 Swing setup idea
🔎 Analysis summary:
The stock crossed above the 50 SMA and closed a double bottom pattern. We are seeing growing, above-average buyers' volume stepping in to support the move.
🔔 Friendly reminder: The broader market is currently trending down, so please keep market weakness in mind before entering any new trades.
👀 Levels to watch:
Entry trigger: Break above $60.45
Target: $71.68
Stop: Under the breakout level
💬 What do you think of this setup? Let me know in the comments! 👇
Good luck!
⚠️ Note: This is for educational purposes only and is not financial advice.
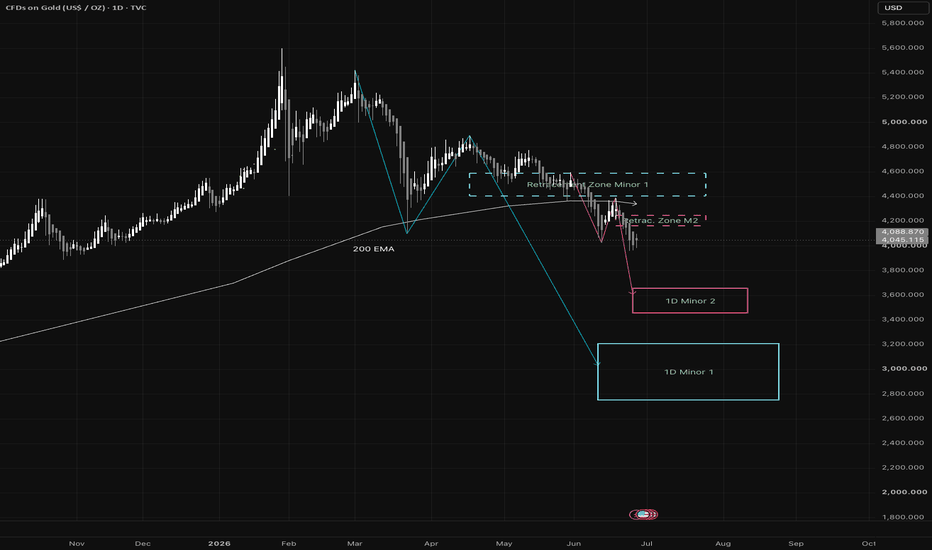
Gold (XAUUSD): Institutional Order-Flow Shifts BearishExecutive Summary
Gold has completed a textbook macro distribution phase on the Daily (1D) timeframe. The most significant structural development is the clean breakdown and confirmation below the dynamic 200 EMA. This shift in the macro regime has opened the door for a multi-wave markdown sequence. By mapping the current nested structures, we can identify two primary bearish paths along with the exact invalidation points that define this macro short thesis.
Market Structure & Order-Flow Analysis
As shown, the market is respecting a series of lower highs and lower lows. Institutional supply is consistently overriding demand at key structural inflections. We are currently tracking two nested bearish sequences: the primary macro wave (1D Minor 1 / blue path) and the immediate acceleration wave (1D Minor 2 / pink path). Previous structural demand levels are systematically flipping into active supply zones.
The Bearish Scenarios
Scenario A: Immediate Acceleration (The Pink Path)
Mechanics: Price has recently rallied into Retrac. Zone M2 (pink dashed box near $4,200) and faced immediate institutional rejection. Under this scenario, order-flow momentum remains highly aggressive, and sellers will press the market lower without requiring a deeper relief rally.
Target: A direct continuation toward the 1D Minor 2 Target Box around the $3,600 liquidity pool.
Scenario B: Deep Corrective Test (The Blue Path)
Mechanics: Should the market experience short-term short-covering or a temporary liquidity hunt, price is expected to gravitate toward the higher supply cluster at Retracement Zone Minor 1 (blue dashed box between $4,400 - $4,600). This zone is highly significant as it confluences directly with the retest of the broken 200 EMA from underneath.
Target: A heavy rejection from this macro supply zone will validate the larger extension down toward the major 1D Minor 1 Target Box near the $3,000 psychological milestone.
Structural Invalidation Levels
To trade this setup safely, we must let the market structure dictate our risk parameters.
1. Immediate Bias Invalidation (M2 Failure)
Level: A sustained Daily candle close above $4,400.
Impact: This invalidates the immediate direct markdown thesis (pink line). It signals that a more complex, deeper corrective rally toward Retracement Zone Minor 1 is underway before the next structural leg down can materialize.
2. Macro Thesis Invalidation (The "C-Point" Break)
Level: A Daily candle close above the C-Point High at $4,900.
Impact: This is the absolute macro invalidation for the entire bearish sequence. Breaking above this specific C-Point completely violates the structural rule of lower highs. Reclaiming this level forces a complete Market Structure Shift (MSS) to the upside, invalidating the markdown phase and exposing the entire downside breakdown as a massive institutional liquidity trap.
Trading Metrics to Watch
Primary Bias: Bearish below $4,600 / Structurally Dead above $4,900.
Key Support-Turned-Resistance: The 200 EMA line.
Volume Profile: Look for volume expanding on down-days to confirm institutional participation in the markdown phase.
Disclaimer
Financial Trading Disclaimer: The analysis, chart structures, and price levels presented in this idea are for educational, informational, and research purposes only. This content does not constitute financial, investment, or trading advice.
What path are you taking here? Are you selling the immediate M2 rejection, or waiting for a deeper retest at the 200 EMA? Let me know your thoughts in the comments below!
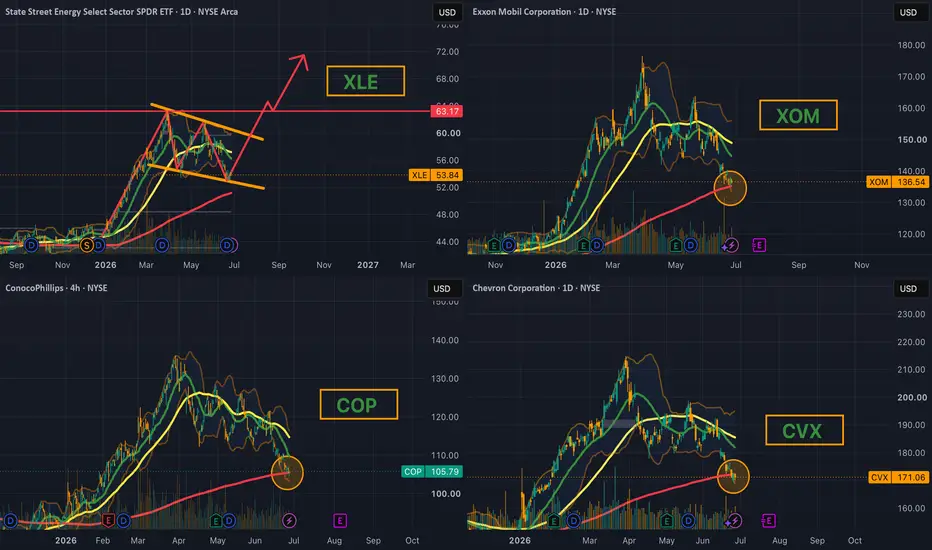
XLE Major Holdings Test 200 MA Simultaneously – High ConfluencesFour of the largest holdings in AMEX:XLE — NYSE:OXY , NYSE:XOM , NYSE:COP , and NYSE:CVX are all approaching or testing their 200-day Moving Average at the same time. This is a rare sector-wide confluence at a major long-term support level.
Key Observations:
• All four names are showing similar price action near the 200 MA.
• Volume has been relatively average on the pullback (no major capitulation yet).
• Energy sector has been strong YTD, making this a high-conviction support zone to watch.
Recommended Trades:
Bullish Setup (Bounce Play):
• Entry: On a strong daily close back above the 200 MA with increasing volume.
• Stop Loss: Below the recent swing low or the 200 MA (whichever is tighter).
• Targets:
• First target: Previous highs / 50-day MA
• Second target: Measured move from the recent decline
• Best for: NYSE:XOM and NYSE:CVX (strongest balance sheets)
Aggressive Setup:
• Scale in on dips toward the 200 MA in NYSE:COP and NYSE:OXY (they’ve pulled back the hardest).
• Use options (slightly OTM calls, 30–45 DTE) for better risk/reward if the bounce materializes.
Bearish Setup (Breakdown Play):
• If any of these names (especially NYSE:COP or NYSE:OXY ) close decisively below the 200 MA with volume, it could signal deeper sector weakness.
• In that case, consider shorting or buying puts on a retest of the 200 MA.
This is a high-conviction moment for the energy sector. The simultaneous test of long-term support across multiple major holdings is worth watching closely.
#XLE #EnergyStocks #200MA #TechnicalAnalysis #TradingSetup