CHF/USD: A Setup for The Leap Participants
For those taking part in The Leap, here is my current view on CHF/USD.
Price continues to move lower after a series of rebalances and is now trading near the lower part of the current range. I expect a local reaction/pullback first, while the main scenario remains a continuation lower toward the 1.414 external expansion and the lower POI.
The key structure and confirmation area are marked on the chart.
Scenario: Local Rebalance → Reaction → Bearish Continuation → 1.414 POI
Pivot Points
TRXUSDT Analyses-48, September 25, 2026
Welcome to my page! I share daily technical analyses of crypto and other charts here.
BINANCE:TRXUSDT
🔍 Market Structure Analysis:
This signal has higher execution risk because the stop loss is very close to the entry. TRX is currently in a short-term bearish correction, with lower highs forming, while price is reacting from an important support area.
🎯 Entry & Exit Signal:
Buy Entry: 0.3389
Stop Loss: 0.3384
Targets: 0.3399 R/R:2 - 0.3415 - 0.3447 - 0.3490
Key Support & Resistance:
Ultragenyx Pharmaceutical (RARE) — Potential Target $30 / 100%Ultragenyx Pharmaceutical has been in a prolonged downtrend after reaching the $60 area, with the price forming a series of lower highs and lower lows. The latest sell-off has pushed RARE sharply lower and the stock is now trading around $14.75, close to an important support area.
The $13–15 zone is the key area to watch. Price has recently reacted from this region after the sharp decline, which suggests that buyers may be starting to defend the lows.
The first important confirmation would be
$BTC - Market Update (9/25)Not much to update here as weekly rvwap is holding price for now.
Interesting to see if we can continue holding 83.4k (swing point) for a 3-tap setup.
If we get a valid swing point retest, still looking for 85.4k-85.9k, then see if it can extend toward the yearly open.
Happy Fri-yay! ✨
ATOM Bullish Continuation: $2.30 Target in FocusATOM is maintaining a bullish continuation structure after successfully retesting its higher-low support area.
Price is holding above the important $1.62 horizontal support zone and is currently trading near $1.78 on the daily timeframe. As long as this support remains intact, the broader bullish structure continues to favor further upside.
Cosmos remains one of the key interoperability-focused blockchain ecosystems, built around the IBC protocol, Cosmos SDK, and CometBFT consensus. These tech
$MSTR back to sub $100Everyone got overly excited in the crypto space and that includes MSTR. However, the MSTR chart doesn't look great.
If we look at the overall trend, you can see that we've been in a downtrend ever since we broke the flag to the downside.
The recent bounce just took us back to the $130 range where we formed a double top. If price can't make it back above $137, then the most likely path is down.
I think we see one final capitulation even that brings MSTR down to the lower support levels with t
MESZ Sep 24: Can 7700 Hold for a Move Back Toward 7800?MESZ sold off overnight and is now trading around 7,729, after testing the higher-time-frame fair value gap near 7,714.
My short-term bias remains bullish, but I’m watching for another possible pullback into the 7,700 area before continuation.
That level lines up with an untested 1-hour fair value gap and could become an important reaction zone.
If buyers defend 7,700 with confirmation, the main upside target is the higher fair value gap around 7,800.
The key invalidation level is 7,675. A confi
USD/CHF is approaching the upper zone of the current moveUSD/CHF is approaching the upper zone of the current move. I expect one more push toward **0.8290–0.8310**, where price could sweep the recent highs and test the external Fibonacci extension.
That reaction will be key. If the sweep is followed by a bearish shift in structure, I’ll look for a move back toward **0.8100**, with the main downside target at **0.8000–0.8030**.
For now, the pair is still moving upward. The short scenario needs confirmation at the upper zone; a sustained move above it
Gold is approaching a key areaGold is approaching a key area on the 30-minute chart. My main scenario allows for one more move lower toward **4250–4255** to complete the current decline and sweep the nearby lows.
I’ll watch how price reacts there. A sweep followed by a return above the level and a bullish shift in structure would support a reversal. In that case, **4310–4315** is the first area to watch, followed by **4335–4350**, where the upper Fibonacci extension levels are located.
This is a conditional long idea, not
NZDUSD: Oversold Market & Pullback 🇳🇿🇺🇸
NZDUSD turned oversold after the last bearish wave.
The price reached an important daily key level and violated a support line of a falling wedge pattern on an hourly time frame.
I expect a pullback to 0.5693
❤️Please, support my work with like, thank you!❤️
I am part of Trade Nation's Influencer program and receive a monthly fee for using their TradingView charts in my analysis.
Apple:Profit target hit! Does iPhone Duo take this to $400?This video presents an update of my Apple trade which was published on 11 September 2026, when pre-orders started for the new iPhone Duo and iPhone 18 Pro, and the ascending channel broke above volume up 31% from its three-month average to $326.57. The primary target price of $340 has been reached at $340.22,12-day advance as a result of consistent institutional buildup, considering the iPhone Duo's release on October 23, where BofA set a price target of $370 and TD Cowen $400. Bullish crossover
WTI Crude Ponders Potential BounceOn Tuesday 15 September, I warned that without a fresh catalyst, I was suspicious of crude oil breakouts. While WTI closed the day higher by the day’s close and at a 4-month high, it was short lived. And only marginally above the 105.21 high. And since then, we have clearly seen the bearish mean-reversion I sought.
But now I suspect the pullback has gone too far. Note the tweezer bottom on the daily chart around the 50-day EMA, and with both of those candles with above-average volume – it sugge
CATI Main trend. Channel. 09 2026Logarithmic scale. 1-week timeframe for clarity; zones identified for potential short-term and medium-term trading. This is a high-risk TON ecosystem asset due to liquidity factors (typical of a Top 500 altcoin), though it trades on almost all major liquid exchanges.
It has declined 97% from its peak. Following the break of the downtrend (decline phase), a sideways range formed ( lasting nearly a year ) with average volatility of around 100%. Price is currently at the channel's first resistanc
XAUUSD Potential bearish reversalGold remains bearish while trading below the 4,338–4,350 supply zone. A retracement into this area could offer a continuation short if sellers show rejection/absorption, with downside targets around 4,280 and potentially 4,270. A clean acceptance above 4,350 would invalidate the setup.
$SOL: Entry on monthly level retest BYBIT:SOLUSDT.P
Hey everyone, welcome back. Today looking at entry setup for Solana.
Right now price is testing historical resistance 📊M-Levels $117.30–$123.45.
But checking 🧩IMA data: 🐋large players adding positions on futures and, more importantly, on spot. Means preparation for resistance breakout is underway.
Two entry scenarios here:
Entry on weekly support 📊W-Levels $113–$115 test — early entry.
Wait for 📊M-Levels $114.50–$117.70 breakout and enter on retest — classic strategy.
🟡 Scen
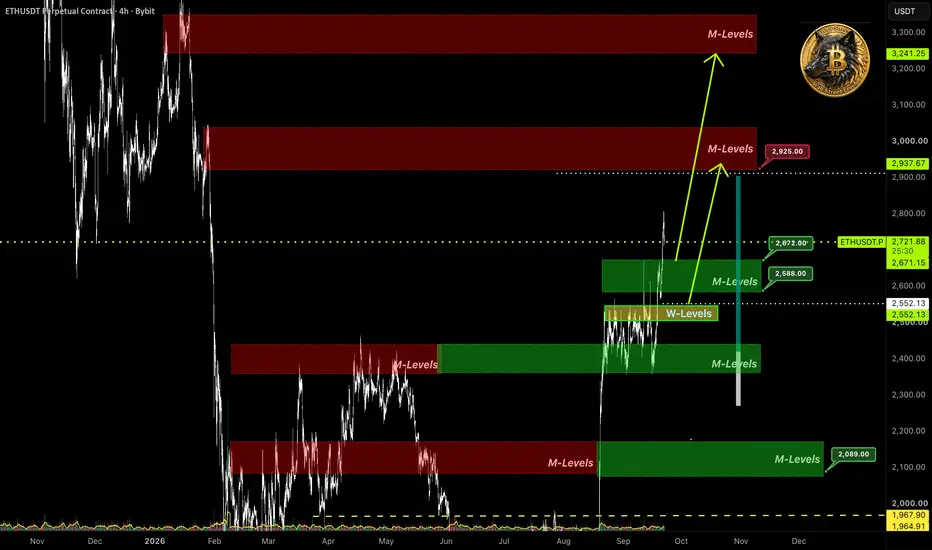
$ETH. Chart breakdown. Entry setup.BYBIT:ETHUSDT.P
CRYPTOCAP:ETH along with the whole market showed a solid move up, breaking the nearest monthly resistance 📊M-Levels.
But unlike BTC, 🧩IMA shows: 🐋large players added to their positions right on the breakout.
Plan for initial entry:
🟢 Entry: $2549–$2673 range
🎯 Target: $2920
⚠️If the idea was useful — glad to have your support 🚀.
Analysis based on 🧩IMA (Integrated Market Analysis)
📊M-Levels — Institutional Interest Level (IIL)
Platform restrictions don't allow publishing clo
$BTC - Market Update (9/22)We got a double top at 87.4k and nearly tagged the yearly open at 87.6k.
Now watching my main long poi around 82-80k (single prints), but I’m also willing to long 83k-82.5k if we get a nice reaction there, ’cuz Bitcoin always front-runs most key levels. If we get a bounce, I think we can still run the highs or even tag the yearly open.
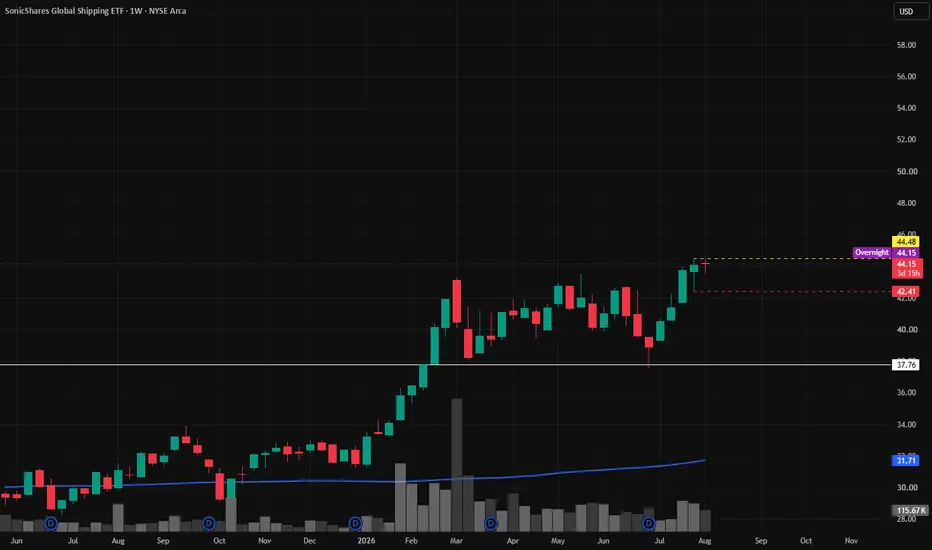
BOAT | Continued growth ETF- Timeframe: Weekly
- Trade type: Buy stop order
- Price: 44.48
- Take Profit: Open
- Stop Loss: 42.41 (-4.70 %)
Idea: Long on a breakout above last week's high - bullish momentum continuation.
Entry: Buy stop above last week’s high.
Stop-loss: Below the low of the same candle.
If the weekly candle closes below this level, the trade is invalidated.
Take Profit: Trailing stop following the lows of new weekly candles.
MESZ Sept 23 | Two Possible Paths: Pullback to 7800 or BreakoutMESZ Technical Analysis — September 23, 2026
MESZ is currently trading around 7,821 following a pullback from the overnight high.
My overall outlook remains neutral to slightly bullish, but the latest price action suggests that we should monitor the lower liquidity levels before assuming another bullish continuation.
4H Analysis
The main upside liquidity is around 7,851, while 7,767 remains my crucial higher-time-frame support.
A confirmed 4-hour close below 7,767 would weaken my bullish ou
NZDUSD | 1H — Watching for a reversal near 0.5690NZDUSD | 1H — Watching for a reversal near 0.5690
NZDUSD remains in a downtrend and is approaching the EMA Shelf around 0.5690. My scenario allows for one final move into or slightly below this support before a potential reversal.
I’m looking for price to reclaim the 0.5710–0.5720 area as the first sign that buyers are returning. If the reversal develops, I plan to take 75% profit near 0.5789 and close the remaining position around 0.5830, just below the highlighted POI.
If price stays below
SOL1! | 4H — Watching for a reversal after one more push higherSOL1! | 4H — Watching for a reversal after one more push higher
SOL futures have rallied sharply and are now trading near the recent high around $119. My scenario allows for one more move above that high, potentially toward the $124–128 area, before a larger correction begins.
I’m not treating the projected peak as an automatic short entry. I want to see price reject the new high and move back below the breakout area first. If that happens, the first major downside target is around $84, where
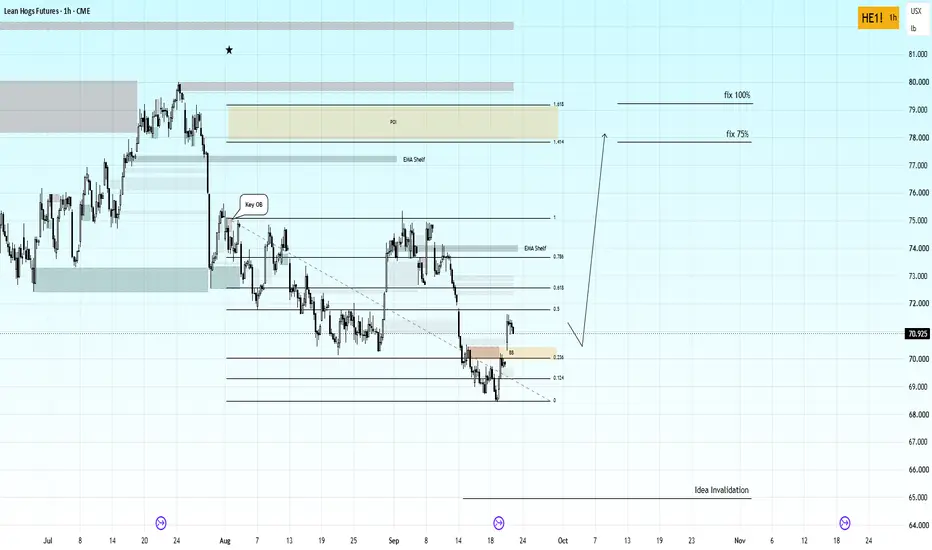
Lean Hogs (HE1!) | 1HLean Hogs (HE1!) | 1H
Price has reacted from the recent low near 68.4 and is now testing the Breaker Block around 70.0–70.4. I’m watching for a retest and hold of this zone before considering the long scenario confirmed.
A move back above 71.8 would strengthen the reversal case. The first key level is 75.1; the main target zone is the Fibonacci expansion between 77.8 (1.414) and 79.2 (1.618).
A break below 68.4 would weaken the local reversal setup. The wider idea invalidation shown on the ch
Momentum Must AgreeGBPUSD
Price had closed positions early due to momentum not being in agreement with structure.
Now looking like price may be seeking deeper mitigation within a deeper POI, inside the major range after taking out the large liquidity pool and reaching into discounted territory.
Until then, I’m just waiting and chilling until price and momentum align with each other.
No need to force anything.
Patience is key. Tracking remains the edge.
Let’s go.