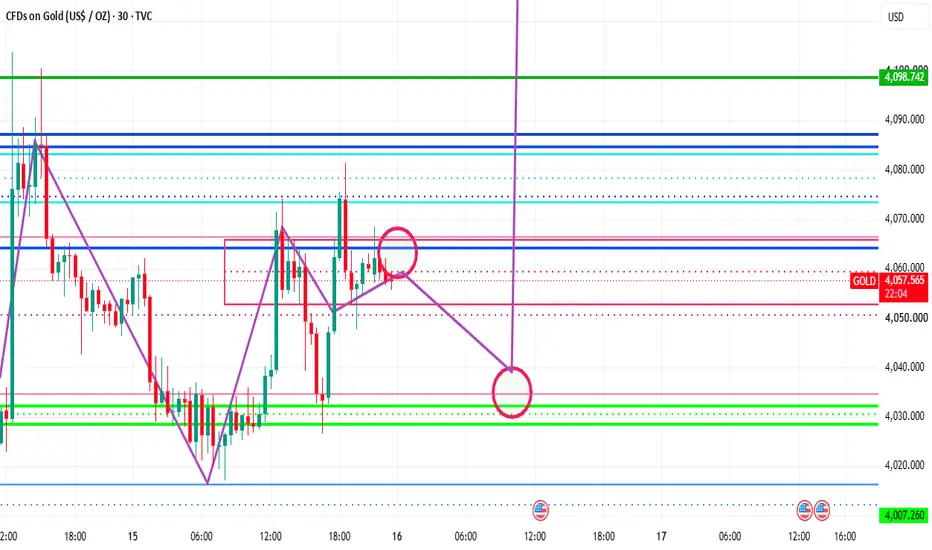
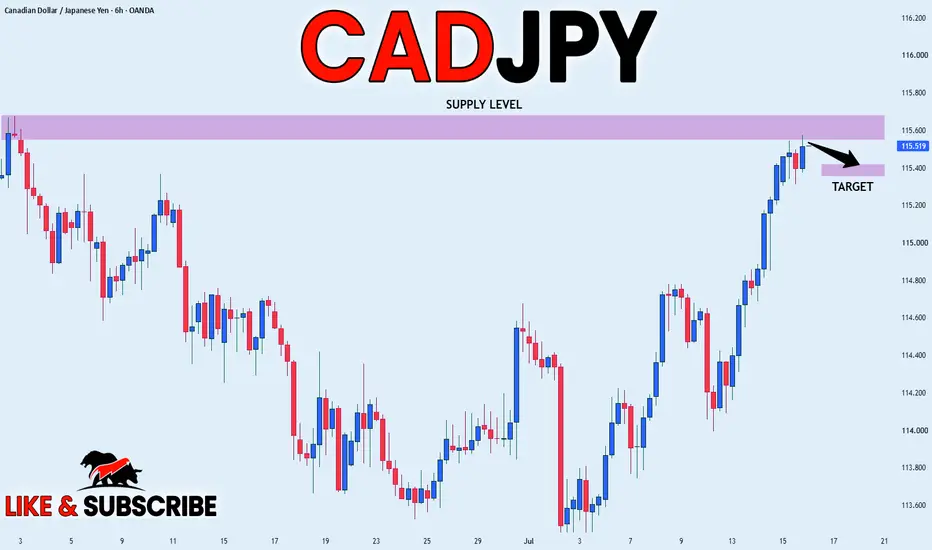
Long
Long
Bitcoin Taking a dip again ??The Up-swing on bitcoin (BTC), again got rejected form a resistance at 64590 and price has consolidated for good amount of time & the consolidation structure appears as a nice topping formation, with the neckline of 64360, which it has already broken out, now the bitcoin might continue it's down-move till it's support of 61940. while price continues its down-move, we can sell on rise for fresh entries, immediate resistance is at 64975 and support is at 63570, 62500 - 62200.
Only sell trades should be preferred on intraday timeframes, for better accuracy.
summary: Almost certain that downfall will continue, Wait for pullbacks for fresh entries. Sell on rise
For Educational Purposes only, Not an Investment Advice, Always use strict Risk management measures.
Regards CrazyTrades247.  Short
Short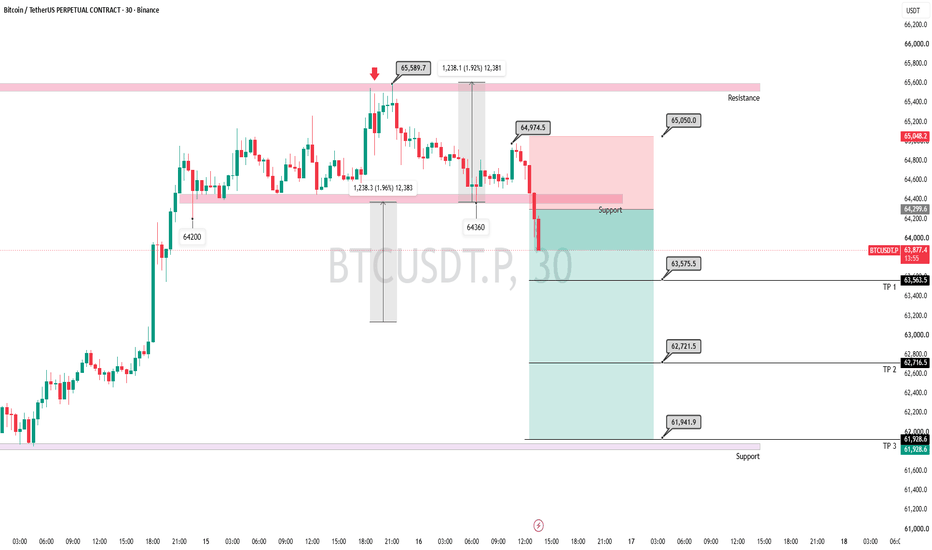
Short 
XAU/USD 16 July 2026 Intraday AnalysisH4 Analysis:
-> Swing: Bullish.
-> Internal: Bearish.
Bias and analysis to remain the same as analysis dated 30 June 2026.
Price did not print bullish CHoCH to indicate bullish pullback phase initiation. Price instead printed a new low followed by a bullish CHoCH
Price is currently trading within and established internal range, however, I will continue to monitor price with respect to depth of pullback.
Intraday expectation:
Price to trade up to either premium of internal 50% EQ, or H4 demand zone before targeting weak internal low, currently priced at 3,942.100.
Note:
Gold remains volatile as tensions between the US, Israel, and Iran keep safe‑haven demand elevated.
Markets are reacting quickly to every headline, while uncertainty around the Fed’s easing path and shifting U.S. policy under President Trump, especially tariffs continues to fuel choppy price action.
For newer traders, the key is simple, stay flexible and manage risk carefully, as fast spikes and sudden reversals are a normal part of the current XAU/USD environment.
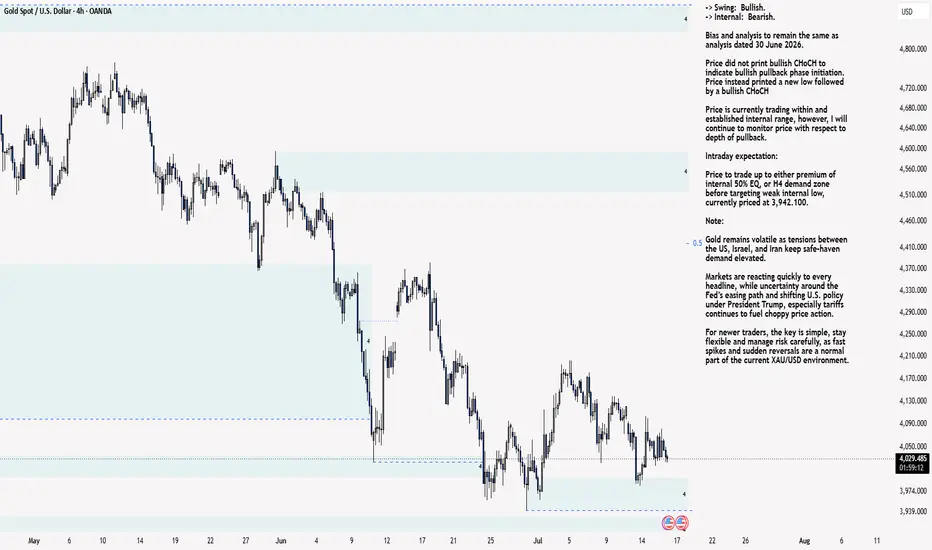
H4 Chart:
M15 Analysis:
-> Swing: Bearish.
-> Internal: Bearish.
Bias and Analysis to remain the same as analysis dated 14 July 2026.
Price has printed according to analysis dated 14 July 2026 where I mentioned in alternative scenario that due to H4 internal structure being bearish, price could potentially target strong internal low and print a bearish iBOS.
Price subsequently printed a bearish iBOS and bullish CHoCH to indicate bullish pullback phase initiation.
Price is currently trading within a established internal range, however, I shall monitor price action with regards to depth of pullback.
Intraday expectation:
Price to trade up to either premium of internal 50% EQ, or M15 demand zone before targeting weak internal low, priced at 3,983.545.
Note:
Gold remains highly reactive on M15 as geopolitical risk continues to drive quick, headline‑led moves.
The tension between the US, Israel, and Iran is keeping safe‑haven demand elevated, with markets still sensitive to any sign of escalation.
At the same time, shifting US tariff policy under President Trump is adding extra uncertainty, fuelling sharp intraday swings and increasing the likelihood of sudden sentiment flips. Liquidity pockets and whipsaws remain common, making disciplined risk management essential.
Gold’s geopolitical premium is still firmly in place, and until tensions ease, short‑term volatility is likely to stay front‑loaded.
M15 Analysis:
-> Swing: Bearish.
-> Internal: Bearish.
Bias and Analysis to remain the same as analysis dated 14 July 2026.
Price has printed according to analysis dated 14 July 2026 where I mentioned in alternative scenario that due to H4 internal structure being bearish, price could potentially target strong internal low and print a bearish iBOS.
Price subsequently printed a bearish iBOS and bullish CHoCH to indicate bullish pullback phase initiation.
Price is currently trading within a established internal range, however, I shall monitor price action with regards to depth of pullback.
Intraday expectation:
Price to trade up to either premium of internal 50% EQ, or M15 demand zone before targeting weak internal low, priced at 3,983.545.
Note:
Gold remains highly reactive on M15 as geopolitical risk continues to drive quick, headline‑led moves.
The tension between the US, Israel, and Iran is keeping safe‑haven demand elevated, with markets still sensitive to any sign of escalation.
At the same time, shifting US tariff policy under President Trump is adding extra uncertainty, fuelling sharp intraday swings and increasing the likelihood of sudden sentiment flips. Liquidity pockets and whipsaws remain common, making disciplined risk management essential.
Gold’s geopolitical premium is still firmly in place, and until tensions ease, short‑term volatility is likely to stay front‑loaded.
M15 Chart:  Short
Short
Who Controls a Trend: A Common MisunderstandingThere's a common misunderstanding about trend direction: that a downtrend means sellers are in control. It doesn't — and the mix-up comes from confusing pressure with control.
If you are looking for longs and price moves away from your entry location, does chasing it at a worse price feel like control or pressure?
Start with someone holding the asset who wants to sell. They want a higher price than today's — that is the whole point of holding rather than selling now. Every time price falls, pressure builds on this holder. They are not getting the price they want, and every candle that closes lower adds to the cost of continuing to wait.
The buyer looking to get into the asset feels none of that pressure. A falling price means a cheaper entry — exactly what they want. They can simply wait for it, for as long as it takes, at no cost to them. That is the buyer in control: not aggression, not activity, just the ability to do nothing while price moves in their favor.
Here is where the common misreading happens. The visible selling — the active, aggressive selling actually pushing the candles down — looks like control. It is not. It is forced activity. It is the pressure on the holder finally showing up as action: a stop hit, a position finally given up on, a decision made under duress rather than on the seller's own terms. What most traders point to as sellers in control, including active shorting into the decline, is pressure finding an outlet, not a position of strength.
The seller who is actually in control looks nothing like that. They are the one who wants the price to rise, and can simply wait for it — refusing to sell at today's price, holding out for their number, unaffected by how long it takes. That is control, and it is the same shape as the buyer's control above, just aimed at the opposite price.
The same logic runs the other way in an uptrend. Now the buyer is under pressure — wanting in, watching the price they wanted to pay get further away with every candle that closes higher, eventually forced to chase it at a worse price than planned, or miss the move entirely. Active, aggressive buying into a rally is that pressure showing up as action, not buyer control. The seller, holding something that is gaining value, feels none of it. They can simply wait for their number, unaffected by the wait. That is the seller in control during an uptrend.
This is also what a genuine structural break actually represents. When a prior low finally gives way with real conviction, it is not sellers seizing control — it is the last patient holders finally running out of room to wait. Their pressure has overwhelmed their patience. What follows, fresh and aggressive shorting into the break, is pressure compounding on pressure, not a calmer hand taking over. The buyer's control has not gone anywhere. If anything, a confirmed break means the buyer can afford to wait for an even lower price than before, since the evidence now says holders are folding faster than they are holding out.
This changes how a spike in volume should get read, too. A sharp drop on heavy volume looks like sellers taking charge. Read through the pressure-versus-control lens, it usually means the opposite: a wave of forced exits from holders who ran out of room, met by buyers who had been comfortably waiting for exactly this price. The volume is real. The control still belongs to whoever did not have to act.
Pull up a trend you are watching right now. Is the side pushing it comfortable — happy with the price, in no hurry — or is what you are seeing pressure finally forcing a hand? Those look identical on a chart. They are not the same thing.  Education
 Long
Long

Short 
AVAX/USDT - It climbed back but it has not escaped the cage yetKatsu on the Bridge. The AVAX radar is showing an interesting, but quite tricky structure right now.
From the first sideways range, price broke down, then almost fully climbed back toward the previous range inside an ascending channel. However, that ascending channel turned out to be more of a corrective bounce, because on July 8, price broke down from it.
Since then, a new range has formed, roughly between 6.34 and 6.80. Right now, price is trading around 6.72, so we are already in the upper third of the range. This is important because this is not a good place to chase longs, while shorts are not active either until we see real rejection.
What Does the Market Structure Say?
After the big drop, the ascending channel may have looked bullish at first, but:
price could not hold above 7.00;
price broke down from the ascending channel;
the lower side of the previous channel no longer held;
the top of the new range formed lower, around 6.80.
Because of this, the 4H picture is still neutral, with a slightly bearish structural tone.
To talk about a real bullish reversal, AVAX would need to reclaim at least the 6.80–7.00 area and hold above it.
The RSI is around 56, so there is some positive momentum, but it is not overbought yet. Buyers are getting stronger, but the indicator alone does not confirm a range breakout. Visible buying and selling volume look fairly balanced, so there is no clear directional decision yet.
Key Support and Resistance Levels
7.00 — has stopped the move several times already
6.80 — top of the current range, first major resistance
6.45–6.50 — reaction zone below the range midpoint
6.36 — a support level, but not a very strong one in my opinion; currently the bottom of the sideways range
6.01 — slowdown zone; if this cannot hold, then the previous low and final 4H defensive zone is around 5.68
LONG Setup — Breakout and Retest
I would not buy blindly at the current price.
A cleaner long setup would activate if:
a 4H candle closes above 6.82;
price retests the broken resistance;
on the 15-minute or 1H chart, the 6.78–6.82 zone starts acting as support.
Possible Plan
Entry: 6.79–6.83
Stop Loss: below 6.65
TP1: 7.02–7.07
TP2: 7.50 — quite ambitious
Invalidation: close back below 6.70
With an entry around 6.81 and a stop around 6.65, the 7.07 target gives roughly a 2.0 RR setup. The key word here is confirmation. A single wick above 6.82 could easily be a liquidity grab. For a long setup, I want to see a proper close and a successful retest. Without that, the entry is just a lottery ticket.
SHORT Setup — Rejection From the Range High
Based on the current chart position, this setup is closer to activation, but it is still not an automatic entry.
Short Conditions
For the short setup, I would want to see:
price wicking into the 6.78–6.82 area;
price failing to hold above it;
a bearish SFP, bearish engulfing candle, or bearish ChoCh on the lower timeframe;
price moving back below 6.74.
Possible Plan
Entry: 6.76–6.80, after confirmation
Stop Loss: around the 6.91 OB
TP1: 6.50
TP2: 6.42
TP3: 6.34
Invalidation: stable 4H close above 6.82
An entry around 6.78, with a stop at 6.91 and a second target at 6.42, gives roughly a 2.7 RR setup. But if price only ranges between 6.70 and 6.78, then there is no short either. I want to see a clear reaction from the top of the range.
This is not financial advice.
The raccoon was simply thinking out loud about AVAX today. I wrote down what I see, what I think, and how I would trade it.
Then either I am right…
or we learn from it. :)) Geopolitical overwhelm soft US data, pressuring the Silver priceHere is the professionally rewritten text, meticulously adhering to all of your formatting, tone, and grammatical constraints.
Despite softer US CPI and PPI prints recently, silver prices failed to rally due to cooling industrial demand in China and persistent hawkish rhetoric from Fed officials.
The recent deceleration in monthly US CPI and PPI metrics fails to soften the Fed's hawkish stance. Fed Governor Cook remains prepared to act if price progress stalls in the coming months, while Fed Chair Warsh characterized the inflation battle as an "incomplete mission," signaling that the central bank might adjust interest rates to anchor inflation. Cook also noted that a stable labor market allows the Fed to prioritize its price stability mandate, which might streamline future interest rate interventions.
The swap market reacted moderately to the soft US CPI and PPI prints, maintaining full pricing for more than one rate hike this Sep.
On the demand side, Solar PV demand for silver in China might contract by over 20%. This contraction cools the primary driver of industrial silver consumption following years of robust expansion, likely applying downward pressure on silver prices over the near term.
From a technical perspective, XAGUSD retraced to test the 57.00 resistance level and held above it. However, the asset remains embedded in a primary downward trend beneath diverging bearish EMAs, pointing to a sustained bearish trajectory.
If XAGUSD sustains its position above 57.00, price action might consolidate within the 57.00 - 59.00 territory.
Conversely, a decisive close below 57.00 might accelerate the downward extension, exposing the subsequent support floor at 54.40.
By Van Ha Trinh - Financial Market Strategist at Exness  Short
Short
 Long
Long
Gold XAUUSD - M15 Chart Analysis* *Gold XAUUSD - M15 Chart Details*
Created: Jul 16, 2026 10:18 UTC+7 by Mr_expert_08
### *1. Current Situation*
*Price:* 4,030.165 -30.530 -0.75%
Price is right inside the *orange demand zone* 4,033 - 4,016
### *2. Chart Analysis*
Ye setup pehle wale M10 chart jaisa hi hai. Buy ka plan hai.
*What happened:*
Strong drop aaya, phir 4,016 ke aas paas price ruka aur base banayi. Ye sellers ki thakawat dikhata hai.
*The Plan on Chart:*
- *Buy Zone:* 4,033.934 se 4,016.506 tak - orange box
- *STOP LOSS:* 4,016.409 ke neeche
- *TP 1:* 4,047.159
- *TP 2:* 4,060.766
Logic ye hai: Demand zone hold karegi aur price upar jayegi.
### *3. Entry Rule*
1. Wait for BOS Up. Yani price 4,033 ke upar close kare aur last high break kare
2. SL hamesha 4,016.409 ke neeche rakhein
3. Lot size: 0.01 se start karein
### *4. Invalidation*
Agar 4,016.409 strong red candle ke sath break ho jaye to ye buy idea cancel. Phir sell ka soch sakte hain.
*Summary:*
`Buy: 4,033 - 4,016`
`SL: 4,016.409`
`TP1: 4,047.159`
`TP2: 4,060.766`
Kya aap chahte hain main is par exact BOS Up ka level mark kar dun taake entry aur clear ho jaye? Long 
Long 
Short 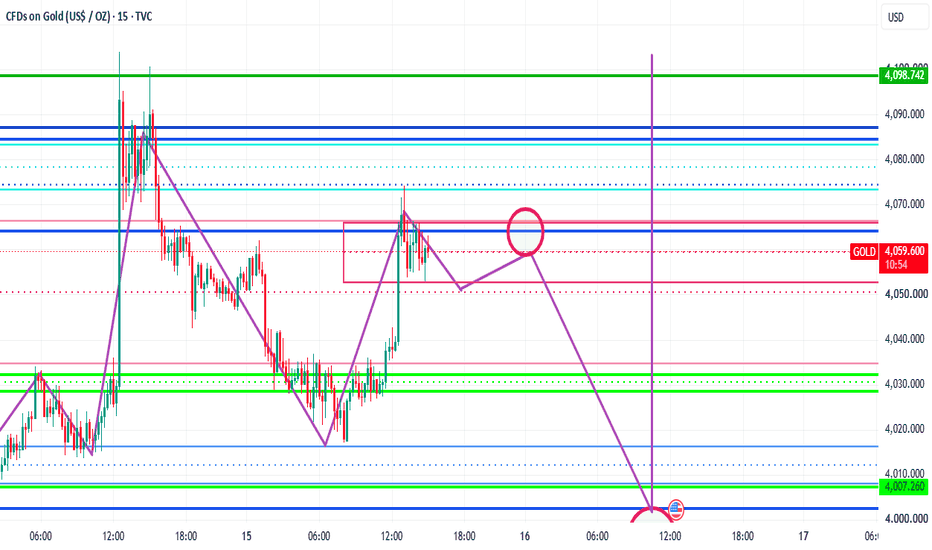
XAUUSD 4H | The Breakout Is the TrapThe structure
One pattern has governed gold for two months: the descending channel from the May highs. Every approach to the channel top used to be met with violent selling – impulsive rejections worth hundreds of points, no hesitation. That was a market with sellers in full control.
What's changing
The most recent touches tell a different story. Rejections have become shallow, and buyers reclaim the losses almost immediately. Price is no longer collapsing from the channel top – it's hugging it. Descending structures typically age exactly like this before they break: the sellers defending the boundary lose conviction, reactions weaken, and pressure builds underneath.
Most traders read that as the start of a reversal. I don't – at least not yet.
My primary scenario
I read the weakening channel as fuel for one final squeeze, not the beginning of a new bull leg:
The break : price pushes through the channel top. Remaining shorts from the channel cover, breakout buyers pile in.
The magnet : that combined flow extends the rally into 4,180–4,200 – the major untested supply above, and the zone sitting right over everyone's stops from the last two months of range highs.
The rejection : this is where I expect the real reaction. Not at the channel line everyone is watching – at the level above it, after the buy-side liquidity has been collected. Markets rarely reverse from the obvious level; they reverse after running it.
The destination : from a confirmed 4,200 rejection, the path opens back through the range toward the 3,900–3,920 demand zone – the origin of the last major rally.
In one sentence: the breakout is the trap, not the trend.
Invalidation
This thesis dies with a clean 4H acceptance above 4,200 – meaning price breaks the zone, holds, and builds structure above it. That's no longer a squeeze; that's a trend change, and I'll post the update saying exactly that. Until then, the two-month structure gets the benefit of the doubt.
How I'll trade it
This is the map, not an entry. No position on the breakout itself – the squeeze leg is the most chaotic part of the sequence. My interest begins IF price reaches 4,180–4,200 and shows a confirmed rejection there (4H structure, not a single wick). Daily setups will be posted separately as price moves through this map.
The plan before. The truth after.
Not financial advice – personal analysis only, manage your own risk.  Short
Short
 Short
Short