EUR/USD 15m Short Setup: Intraday Resistance Retest & Bearish CoAnalysis of the EUR/USD 15-minute chart showing a potential short opportunity following a rejection at a key resistance level:Trend & Structure: Price remains in a short-term bearish market structure after forming a local low near 1.1314 followed by a corrective bounce. Supply Zone: The recent upward retracement has run into a resistance / supply zone around 1.1339 - 1.1346, showing signs of buyer exhaustion. Trade Parameters:Entry Zone: Around 1.13388 - 1.13391. Stop Loss: Above the recen
Supply and Demand
CHFJPY FREE SIGNAL|LONG|
✅CHFJPY is sweeping sell-side liquidity into the discount mitigation block, where renewed bullish order flow may trigger displacement toward the overhead buy-side liquidity target.
—————————
Entry: 188.45
Stop Loss: 187.82
Take Profit: 189.29
Time Frame: 6H
—————————
LONG🚀
✅Like and subscribe to never miss a new idea!✅
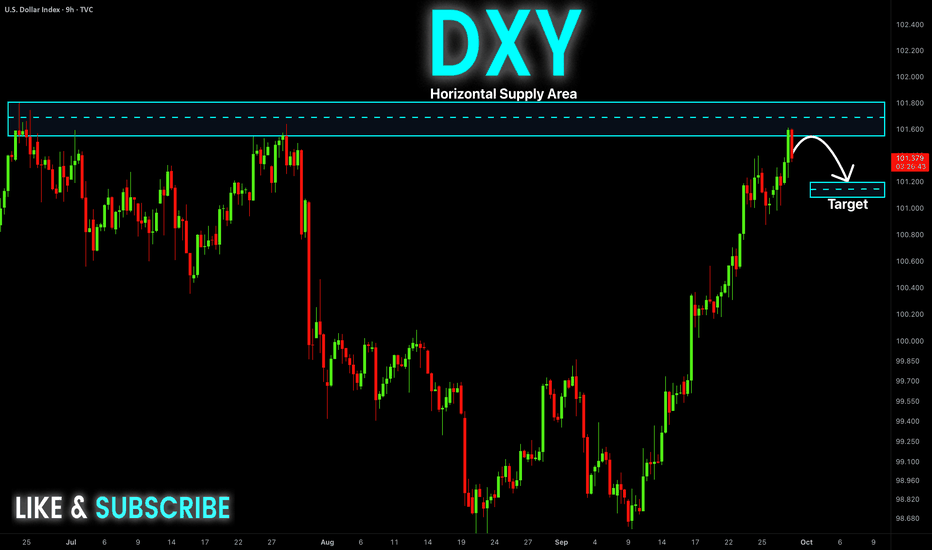
DXY Short From Supply Area! Sell!
Hello,Traders!
DXY is pressing into the horizontal supply area after an extended bullish run, where distribution and a liquidity sweep may trigger a bearish rotation toward the marked target below.Time Frame 9H.
Sell!
Comment and subscribe to help us grow!
Check out other forecasts below too!
AUD-JPY Rebound Expected! Buy!
Hello,Traders!
AUDJPY is tapping the horizontal demand area after sustained bearish pressure, where a liquidity grab into discount may trigger accumulation and a recovery toward the marked target level.Time Frame 7H.
Buy!
Comment and subscribe to help us grow!
Check out other forecasts below too!
EUR-JPY Free Signal! Buy!
Hello,Traders!
EURJPY is testing the horizontal demand area after a sustained bearish move, with a liquidity sweep into discount supporting accumulation and a rebound toward the marked take-profit level.
------------------
Stop Loss: 177.85
Take Profit: 178.62
Entry: 178.18
Time Frame: 4H
------------------
Buy!
Comment and subscribe to help us grow!
Check out other forecasts below too!
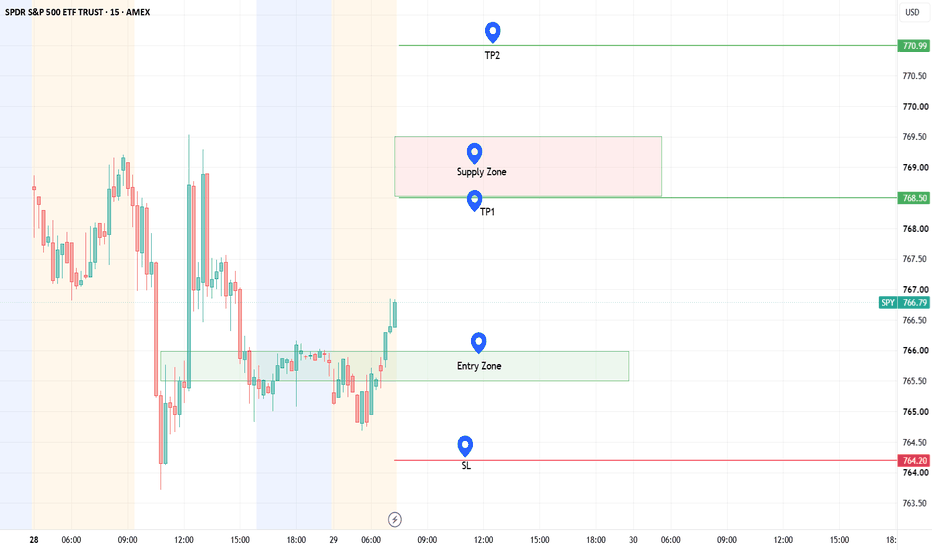
SPY 15m — Long setup at 765.50-766.00 demandSetup
-----
SPY broke local resistance off the 764.50 low and left a fresh bullish order
block at 765.50–766.00, which also lines up with the OTE pullback of the leg
up. Plan is a pullback entry with confirmation — not a mid-range chase.
Levels
------
Entry: 765.50 – 766.00 (mid ~765.75)
SL: 764.20 (~1.55 pts risk)
TP1: 768.50 (~1.8R — take partials)
TP2: 771.00 (~3.4R)
Trigger
-------
Price must rotate into 765.50–766.00 and print a 1m/3m bullish ChoC
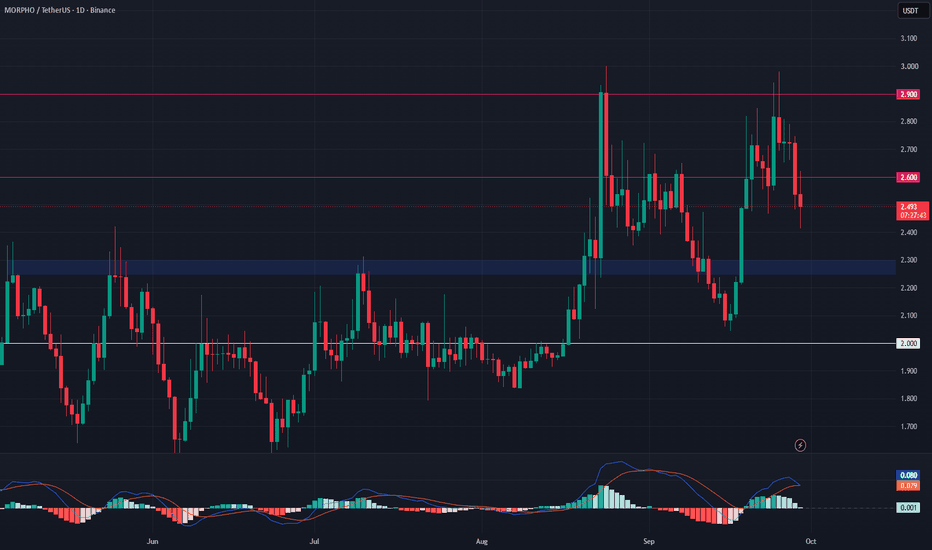
MORPHO Bullish Breakout: $2.90 Target in FocusMORPHO is showing a bullish recovery structure on the daily timeframe after forming a rounded bottom from the $2.032 base.
Price has pushed higher from this support zone and is now trading around the $2.50 area, where it is testing nearby market structure.
The technical outlook remains constructive while buyers continue to defend the $2.25–$2.30 support zone. Holding above this area could support another upward move toward the next resistance levels.
From a fundamental perspective, Morpho is
AUDCHF (1H): Bearish Idea, Sell the Supply ZoneBias: Short from supply (pending sell limit)
Timeframe: 1H (with 4H context)
Analysis
AUDCHF has been ranging and choppy since the swing high near 0.5882, with a rejection from the 0.5865-0.5870 area. Since then:
Price has printed lower highs, and the spike to about 0.5855 (the marked liquidity line) was sold off immediately, a sign of weak buyer follow-through.
The 0.5865-0.5870 zone is the last area where sellers pushed price down hard, so it is the most likely place for them to defend
AUDNZD (1H): Bearish Idea, Sell the Supply RetestBias : Short
Timeframe: 1H (with 4H/Daily context)
Analysis
AUDNZD ran up from the 1.2210 area into the 1.2480-1.2495 zone. The move up on Sept 22 made a sharp wick high and was rejected immediately, which points to buyers being exhausted and sellers defending that supply.
Since then:
Price broke the ascending trendline that supported the whole rally.
It has been printing lower highs under a descending trendline.
Sellers stepped in at the 1.2457 shelf, where price rejected earlier and th
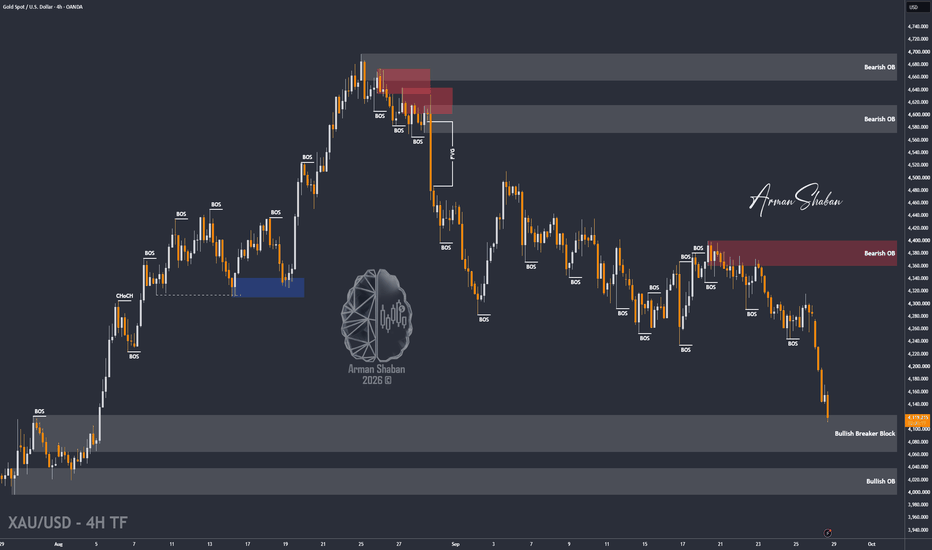
XAU/USD | First LONG, Than SHORT ! What's Next ?By analyzing the #Gold chart on the 4H timeframe, we can see that the bearish scenario played out beautifully. Gold reached all our downside targets at $4279, $4263, $4244 and $4234 , then continued collapsing all the way toward $4114 , delivering more than 1700 pips of movement today alone.
Price has now reached an important Bullish Breaker Block , so I expect some short-term buying pressure and a possible corrective move higher. We also still have the weekly opening gap between $4275 an
SPX500 — 4H | Bullish — Wave 4 Complete, Wave 5 Continuation TarBias: LONG
The index has completed a clean 5-wave impulse structure off the April low, currently correcting through wave (4) into the 7,565 .7–7,600 .0 demand zone — right at confluence with the long-term ascending trendline that's held structure since April. This is the classic wave 4 "alternation" pullback before the final wave 5 push.
Narrative:
Waves (1) through (3) completed the initial impulse into the 7,750 .0–7,800 .0 resistance zone
Wave (4) correction is now tagging trendline + d
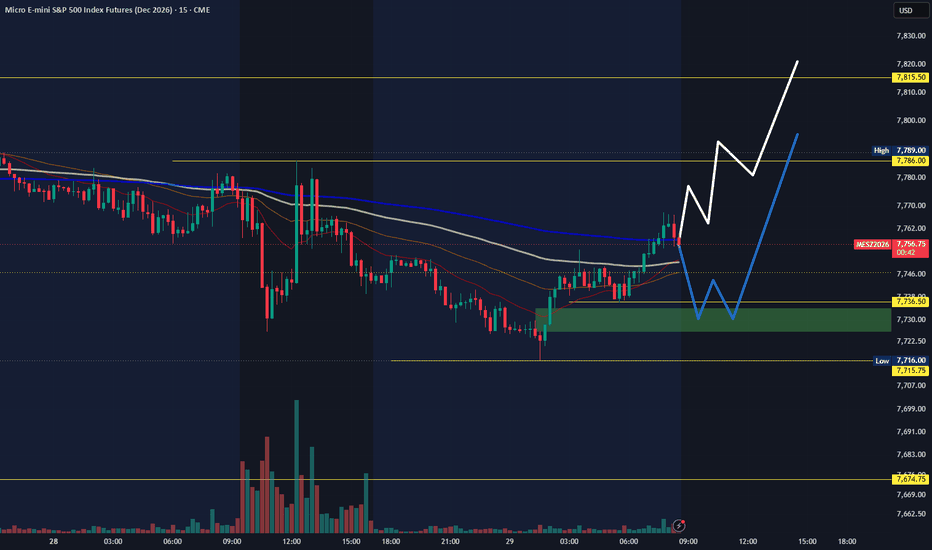
MESZ Sep 29: Pullback to 7736 Before a Break Toward 7850?MESZ has bounced strongly from the recent lows and is now trading around 7,756.
The short-term structure is improving, but I’m watching for a possible pullback into the 7,735–7,736 fair value gap before another continuation higher.
If buyers defend that zone, the first major upside level is 7,786.
A confirmed 4-hour close above 7,786 could support continuation toward last week’s high around 7,850.
On the downside, 7,715 is the key higher-time-frame support. A confirmed 4-hour close below that le
Ethereum: The Setup Is Building, But $2,780–$2,800 Is the KeyHI!
Ethereum is currently developing a potential Head & Shoulders pattern on the 30-minute chart.
The structure is fairly clear: the left shoulder formed around the 2,640–2,660 area, followed by a deeper head that swept into the 2,600 flip zone. Price then recovered and formed a right shoulder around 2,650–2,660.
The key level to watch is the neckline around 2,640–2,655. As long as this area holds, the pattern remains valid, and ETH could attempt another move higher.
For the bullish scenario
BankNifty levels - Sep 30, 2026Utilizing the support and resistance levels of BankNifty, along with the 5-minute timeframe candlesticks and VWAP, can enhance the precision of trade entries and exits on or near these levels. It is crucial to recognize that these levels are not static, and they undergo alterations as market dynamics evolve.
The dashed lines on the chart indicate the reaction levels, serving as additional points of significance. Furthermore, take note of the response at the levels of the High, Low, and Close va
Nifty levels - Sep 30, 2026Nifty support and resistance levels are valuable tools for making informed trading decisions, specifically when combined with the analysis of 5-minute timeframe candlesticks and VWAP. By closely monitoring these levels and observing the price movements within this timeframe, traders can enhance the accuracy of their entry and exit points. It is important to bear in mind that support and resistance levels are not fixed, and they can change over time as market conditions evolve.
The dashed lines
The same MSB that launched Solana is what we sell into nowSolana ran clean off the reversal — MSB, then BOS, then an explosion straight through the resistance that had capped price all year. Now it's tapping into supply and this is where we start hunting shorts.
🟠 Why This Level Matters:
Price exploded off a textbook MSB into BOS and broke the major resistance that held for months. That expansion has now delivered price into the first supply zone at 120–130, which has already been partially filled. This is the first logical area for sellers to step
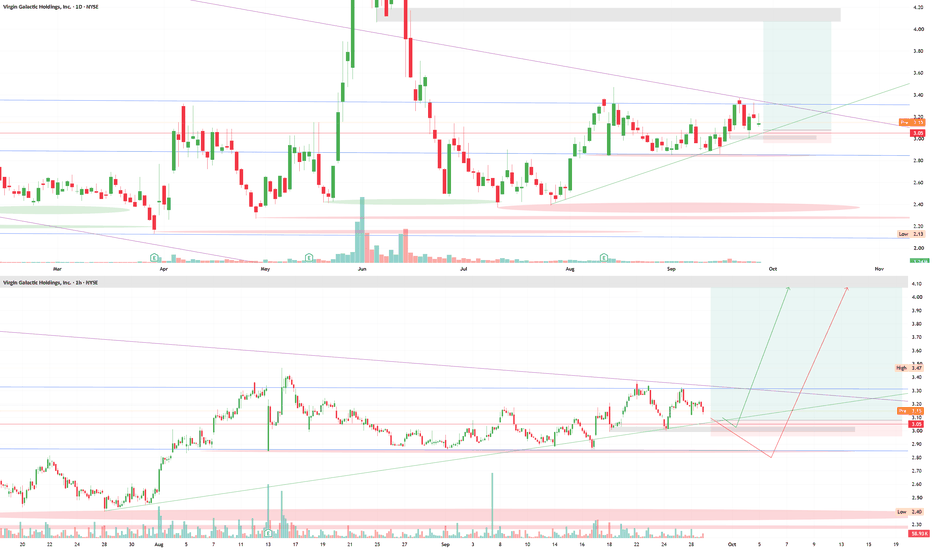
SPCE - Ready for blast off? Short-term trade ideaThe more I analyze NYSE:SPCE , the more I believe it's priming for a move back to HTF supply at $4.10. That's a massive level where tons of liquidity was exchanged during the previous rip up.
Thankfully I've stayed patient here for a while because we haven't done too much in the past few months. Nor do I think we are ready for an extended move past $4.
However, though there is tons of obvious liquidity sitting just underneath the $3/$2.50 levels, I also am seeing the bulls really stepping at
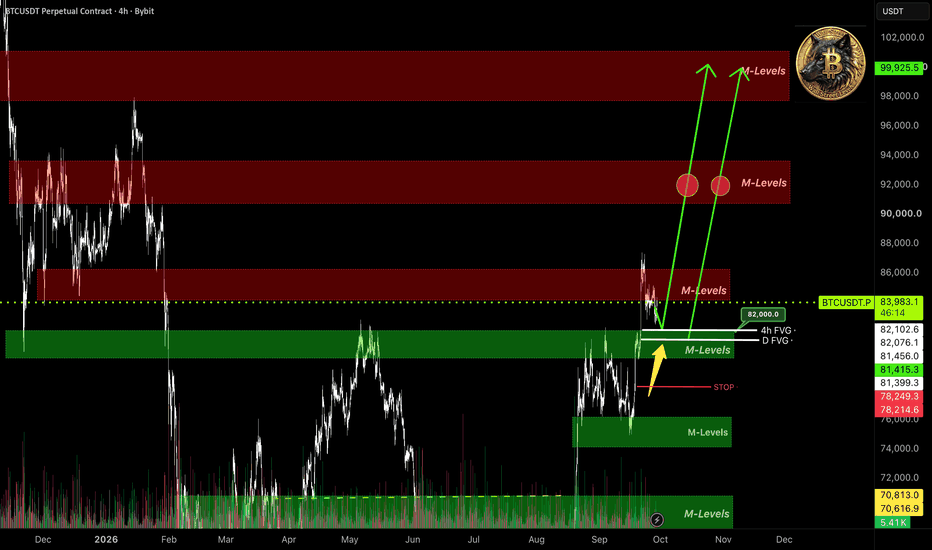
$BTC: Chart breakdown Sept 29BYBIT:BTCUSDT.P
Breakdown per subscriber request.
BTC trading at monthly support 📊M-Levels $84200–$86200. As I said in past reviews, looking to fill 4H and daily FVG at $81915 and $81473.
🧩IMA shows slight drop in 🐋large player positions and spot capital outflow from shortened US Sunday session. Doesn't contradict overall market picture.
Too early to call a sentiment shift.
Given the steady drop structure, can set entries just above market interest levels.
🟡 Trade plan (Long)
🟢 1. Entry: $81
Nifty 50 – Long-Term Trend at a Critical LevelThe 200-week SMA has acted as an important long-term trend reference for the Nifty 50 across multiple market cycles. The chart highlights several instances where prolonged corrections found support around this moving average before the broader uptrend resumed.
Nifty is now approaching the 200-week SMA near 22,606, with the index currently around 22,716 with a low at 22569.
The investment thesis is simple: this is an important zone to monitor for a long-term trend response. A sustained hold aro
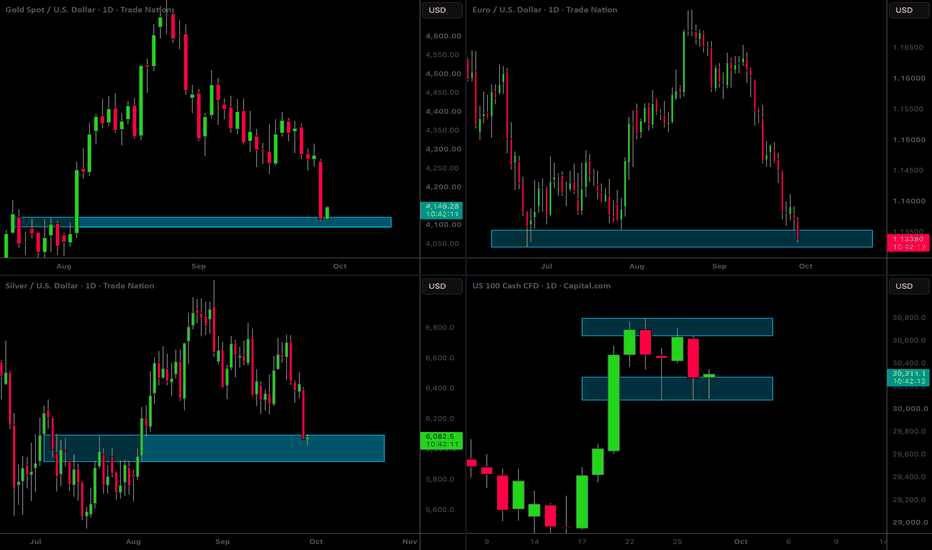
MarketBreakdown | GOLD, EURUSD, SILVER, US100
Here are the updates & outlook for multiple instruments in my watch list.
1️⃣ #GOLD #XAUUSD daily time frame 🥇
The price reached a major daily demand cluster.
With a high probability, a pullback will occur.
Alternatively, its breakout will push the market to 4050 level.
2️⃣ #EURUSD daily time frame 🇪🇺🇺🇸
The market is approaching a major support cluster.
Its breakout and a daily candle close below it will be an important event
that will signify a highly probable bearish continuation w
EURUSD Long: Rebounds From 1.1360 Demand — 1.1430 Comes FocusHello traders! Here’s my technical outlook based on the current EURUSD (4H) chart structure. EURUSD previously traded inside a range before breaking higher into an ascending channel and later forming a descending channel. Price then tested the Demand Zone near 1.1360 and bounced.
Currently, EURUSD is trading below the 1.1430 Supply Zone while holding above the 1.1360 Demand Zone. The recent bounce from support suggests buyers are preparing for another move higher.
As long as EURUSD remains abo
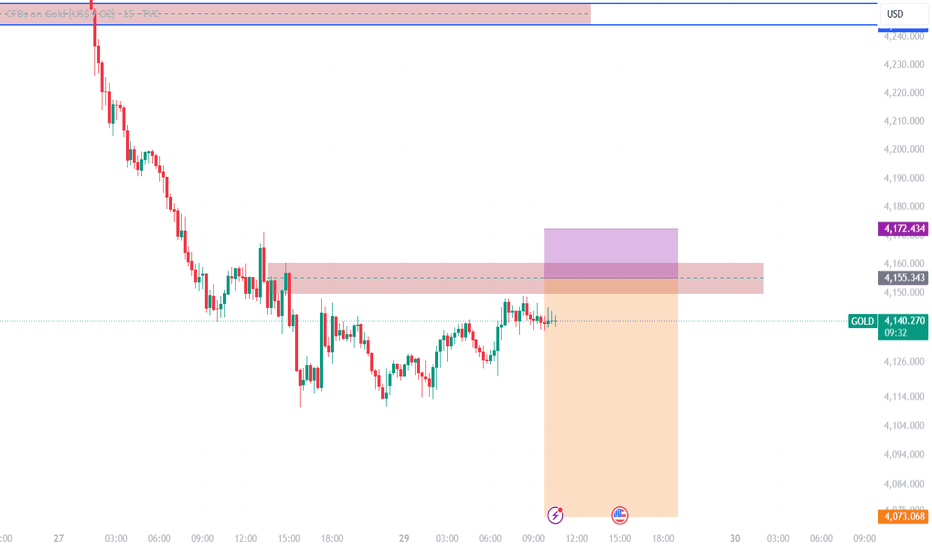
XAU/USD 15m Short Setup: Resistance Zone Retest & Bearish ContinOn the Gold (XAU/USD) 15-minute chart, a potential short position is setting up following a retest of a key resistance level:Trend & Retest: After a strong sell-off from recent highs, price is retracing back toward the supply zone located between $4,150.00 and $4,160.00. Market Structure: The highlighted red box acts as a strong resistance zone (previous support flipped into resistance). A rejection beneath this area indicates potential continuation of the bearish trend. Trade Parameters:Ent