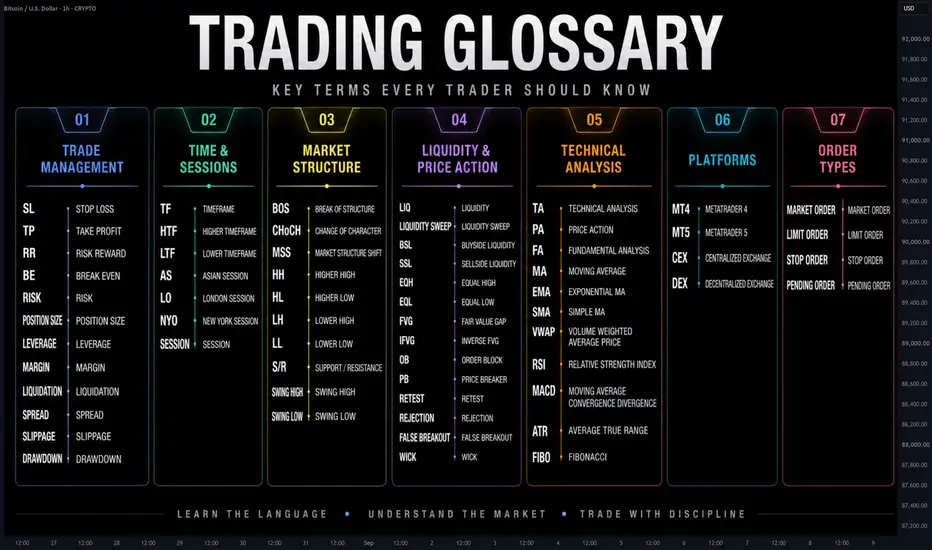
The Trading Glossary Every Beginner Trader Should KnowThe Trading Glossary Every Beginner Trader Should Know When you start trading, the hardest part is not always reading the chart.
Sometimes, it is simply understanding the language traders use.
You will see terms like SL, TP, BOS, FVG, OB, Liquidity, Pullback, RR, TF and many others everywhere.
This guide is designed as a simple reference for beginners — from basic trade management to technical analysis and market structure.
Save it. You will probably need it again.
01 — TRADE MANAGEMENT
SL — Stop Loss
A Stop Loss is an order used to automatically close a trade at a predefined price if the market moves against you.
Its primary purpose is to limit potential loss.
You can place it with your broker or exchange, so the position can be closed even when you are not watching the market.
A Stop Loss does not guarantee the exact execution price during extreme volatility or gaps.
TP — Take Profit
Take Profit is an order used to automatically close a trade when price reaches a predefined profit target.
Traders can use multiple targets, such as:
TP1 → TP2 → TP3
This allows part of a position to be closed while the remaining position stays open.
Entry
The Entry is the price or area where you plan to open a trade.
An entry can be based on a specific price, a zone, or confirmation from price action.
BE — Break Even
Break Even means moving the Stop Loss to the entry price.
If price reaches the entry again, the trade may close around zero profit or loss, excluding fees and execution costs.
RR / R:R — Risk-to-Reward Ratio
The Risk-to-Reward Ratio compares the amount you are risking with the potential reward.
For example:
Risk = $100
Potential Reward = $300
That is approximately:
1:3 RR
RR does not predict whether a trade will win. It simply describes the relationship between potential risk and potential reward.
RISK — Risk
Risk is the amount of capital you are willing to lose if your trade reaches its invalidation or Stop Loss.
Professional traders define risk before entering the trade.
Position Size
Position size is the amount of an asset you trade.
It should be calculated based on your account size, risk percentage, entry price and Stop Loss distance.
Leverage
Leverage allows traders to control a larger position with less initial capital.
It can increase potential returns, but it also increases the speed and magnitude of potential losses.
Leverage does not make a trade safer.
Margin
Margin is the capital required to open and maintain a leveraged position.
If available margin becomes insufficient, a position may be liquidated.
Liquidation
Liquidation occurs when an exchange automatically closes a leveraged position because the trader no longer has enough margin to maintain it.
Spread
The Spread is the difference between the Bid and Ask price.
A wider spread increases the cost of entering and exiting a trade.
Slippage
Slippage occurs when your order is executed at a different price than expected.
It can become more significant during high volatility or low liquidity.
Drawdown
Drawdown measures the decline in an account from a previous equity high to a subsequent low.
It is an important measurement of trading risk and performance.
02 — TIME & MARKET SESSIONS
TF — Time Frame
A Time Frame determines how much time each candle represents.
Examples:
1M → 1 minute
5M → 5 minutes
15M → 15 minutes
1H → 1 hour
4H → 4 hours
1D → Daily
1W → Weekly
HTF — Higher Time Frame
A Higher Time Frame is a larger chart interval used to understand the broader market structure.
Examples:
4H, Daily, Weekly
LTF — Lower Time Frame
A Lower Time Frame provides more detailed price action.
Examples:
1M, 5M, 15M
Traders often use HTF for context and LTF for execution.
AS — Asian Session
The Asian Session is one of the major global trading sessions.
Market liquidity and volatility can differ significantly from the European and US sessions.
LO — London Open
London Open refers to the opening period of the London trading session.
It is often watched because liquidity and volatility can increase around this time.
NYO — New York Open
New York Open refers to the opening period of the New York trading session.
It is particularly important for Forex, Gold and US-related markets.
Session
A Trading Session refers to a specific period of market activity, such as Asia, London or New York.
Time does not tell you where price will go.
It helps you understand the environment in which price is moving.
03 — MARKET STRUCTURE
BOS — Break of Structure
Break of Structure occurs when price breaks an important previous swing point.
It can provide information about a potential continuation or change in market structure.
CHoCH — Change of Character
Change of Character describes a potential shift in market behavior or structure.
For example, a market that has been creating lower highs and lower lows may show a CHoCH when it breaks an important lower high.
MSS — Market Structure Shift
Market Structure Shift refers to a meaningful change in the sequence of highs and lows.
It is commonly used to identify a potential transition from bullish to bearish conditions, or vice versa.
HH — Higher High
A Higher High is a swing high that forms above the previous significant swing high.
HL — Higher Low
A Higher Low is a swing low that forms above the previous significant swing low.
A sequence of HH + HL generally describes bullish structure.
LH — Lower High
A Lower High forms below the previous significant swing high.
LL — Lower Low
A Lower Low forms below the previous significant swing low.
A sequence of LH + LL generally describes bearish structure.
S/R — Support & Resistance
Support is an area where buying interest has previously appeared.
Resistance is an area where selling pressure has previously appeared.
These are usually better treated as zones, not perfectly precise lines.
Swing High
A Swing High is a local price high formed between lower highs around it.
Swing Low
A Swing Low is a local price low formed between higher lows around it.
04 — LIQUIDITY & PRICE ACTION
LIQ — Liquidity
Liquidity refers to available buying and selling interest in the market.
In technical trading, traders often watch areas where many Stop Losses or pending orders may be concentrated.
Liquidity Sweep
A Liquidity Sweep occurs when price temporarily moves through an important high or low, triggering orders, and then reverses or returns back into the previous range.
Stop Hunt
A Stop Hunt is a commonly used term for a move through an obvious level that triggers clustered Stop Loss orders before price reverses.
It should not automatically be assumed that every wick is a Stop Hunt.
BSL — Buy-Side Liquidity
Buy-Side Liquidity generally refers to liquidity resting above important highs.
SSL — Sell-Side Liquidity
Sell-Side Liquidity generally refers to liquidity resting below important lows.
EQH — Equal Highs
Two or more highs forming around a similar price level.
Traders often watch the area above them for potential buy-side liquidity.
EQL — Equal Lows
Two or more lows forming around a similar price level.
The area below them may contain potential sell-side liquidity.
Wick
A Wick is the portion of a candlestick extending beyond the candle's body.
It represents prices that were reached but not maintained at the candle's close.
Rejection
A Rejection occurs when price reaches an area but fails to maintain acceptance there and moves away.
False Breakout
A False Breakout occurs when price breaks an important level but fails to continue and returns back through the level.
05 — ENTRY CONCEPTS
PB — Pullback
A Pullback is a temporary move against the current directional movement.
For example:
Bullish move → Pullback → Potential continuation
A pullback is not automatically a reversal.
Retest
A Retest occurs when price returns to a previously broken level or structure to test it again.
FVG — Fair Value Gap
A Fair Value Gap is an imbalance created by a strong price movement where trading activity leaves a relatively inefficient area between candles.
Traders may watch FVGs as potential reaction or retracement zones.
IFVG — Inverse Fair Value Gap
An Inverse Fair Value Gap refers to an FVG that has been violated and subsequently changes its potential role.
For example, an area that previously acted as support may later become resistance after a decisive break.
OB — Order Block
An Order Block is a price area that traders identify as the origin of a significant impulsive move.
Different trading methodologies define Order Blocks differently, so the term should not be treated as a universally standardized concept.
Breaker Block
A Breaker Block is generally an Order Block or structure zone that fails and later acts from the opposite side.
Mitigation
Mitigation generally describes price returning to a previously identified zone to rebalance or react before continuing.
Premium
In market-structure methodologies, the Premium area refers to the upper portion of a defined range.
Discount
The Discount area refers to the lower portion of a defined range.
Traders may use these concepts to evaluate whether price is relatively expensive or cheap within a specific range, not in absolute terms.
06 — TECHNICAL ANALYSIS
TA — Technical Analysis
Technical Analysis is the study of price, volume, structure and market behavior using charts and technical tools.
FA — Fundamental Analysis
Fundamental Analysis evaluates the underlying economic, financial or business factors that may influence an asset's value.
PA — Price Action
Price Action is the analysis of market behavior directly from price movement, candles and structure.
MA — Moving Average
A Moving Average smooths price data to help traders identify trends and market direction.
EMA — Exponential Moving Average
An EMA gives greater weight to more recent prices than a simple moving average.
SMA — Simple Moving Average
An SMA calculates the average price over a specified number of periods.
VWAP — Volume Weighted Average Price
VWAP calculates the average traded price weighted by volume.
It is widely used to evaluate the average price at which trading activity occurred during a specific period.
RSI — Relative Strength Index
RSI is a momentum indicator used to measure the strength and speed of price movements.
MACD — Moving Average Convergence Divergence
MACD is a momentum and trend-following indicator based on moving averages.
ATR — Average True Range
ATR measures market volatility.
It does not predict direction; it helps traders understand how much an asset is typically moving.
FIBO — Fibonacci
Fibonacci Retracement and Fibonacci Extension tools are used to identify potential retracement and projection levels based on mathematical ratios.
Common levels include:
0.382
0.500
0.618
0.786
1.000
1.618
07 — TRADING PLATFORMS
MT4 — MetaTrader 4
MetaTrader 4 is a trading platform widely used for Forex and CFD trading.
MT5 — MetaTrader 5
MetaTrader 5 is the newer MetaTrader platform, supporting multiple asset classes and advanced trading functionality.
CEX — Centralized Exchange
A Centralized Exchange is a trading platform operated by a centralized company.
DEX — Decentralized Exchange
A Decentralized Exchange allows users to trade through blockchain-based protocols rather than relying entirely on a centralized intermediary.
08 — ORDER TYPES
Market Order
An order designed to execute immediately at the best available price.
Limit Order
An order placed at a specified price or better.
It allows traders to wait for price to reach their desired level rather than entering immediately.
Stop Order
An order that becomes active when price reaches a predefined trigger level.
Pending Order
A general term for an order waiting to be triggered in the future.
The Most Important Lesson
Learning these abbreviations is useful.
But knowing the vocabulary does not make someone a trader.
Understanding risk, market structure, execution, probability and psychology is far more important.
You don't need to trade every BOS.
You don't need to enter every FVG.
You don't need to chase every breakout.
And you certainly don't need to understand every indicator on TradingView.
The goal is not to find more reasons to trade.
The goal is to understand when there is a reason to trade — and when there isn't.
Save this glossary. Learn the language first. Then learn how to use it.
Risk Warning
This content is for educational purposes only and should not be considered financial or investment advice. Trading financial markets, particularly with leverage, involves substantial risk. Always understand the instrument you are trading and define your risk before entering a position.
 Education
Cheniere Energy: Next Structural Move? — 3M | 1M | 1W | 1D | 4HCheniere Energy: Decoding the Multi-Degree Structural Architecture on the Threshold of the Next Major Move
Integrated Structural, Time, and Price Analysis Across the 3M, 1M, 1W, 1D, and 4H Timeframes
────────────────────────────────────────────────
1. Structural Hypothesis
Cheniere Energy is currently at a sensitive stage of its long-term structural development. Price has moved toward the upper regions of the broader structure, while the final identity of the higher-degree structure remains unresolved.
At the Cycle degree, only the initial point, , can currently be regarded as structurally confirmed. The opposing endpoint, , has not yet been determined, and therefore the final endpoint of the current long-term structure remains an open structural variable.
As a result, the current condition cannot be reduced to a predetermined price target or reversal point. Instead, the market is moving toward a Time–Price decision zone; an area in which several plausible structural scenarios remain active.
In the 3M timeframe, the primary time windows are 2.618, 3.618, and 5.0, measured relative to .
Along the price axis, the structure has so far moved through the 75%, 78.6%, and 100% levels, while the 127.2%, 150%, 161.8%, 200%, and 261.8% levels may still act as potential areas for continued structural extension or completion.
Therefore, the primary question is not simply whether Cheniere Energy will continue its upward movement; rather, the central question is:
To which structural degree does the current upward movement ultimately belong?
At the higher degree, two primary possibilities remain: Is the market completing (N.1), or is it developing toward ?
At the monthly degree, the question is whether the current sequence completes as a five-phase structure or extends into a seven-phase development.
The 1W, 1D, and 4H structures are used not as independent forecasts, but as evidence from lower degrees to progressively clarify the unresolved structure at the higher degree.
Accordingly, Cheniere Energy should currently be regarded as a conditional structural transition; meaning that the market itself must determine which of the higher-degree scenarios ultimately remains valid.
Figure 1 — Long-Term Structural Origin in the 3M Timeframe
────────────────────────────────────────────────
2. Structural Hierarchy
The analysis progresses through a hierarchical sequence:
3M | 4 | Cycle | ➔
1M | 3 | Primary | → → → →
1W | 2 | Intermediate | (N.1) ➔ (L.1) ➔ (N.2)
1D | 1 | Minor | α ➔ β ➔ γ ➔ δ ➔ ω
4H | 0 | Minute | P.a ➔ v.β ➔ P/Pc.c
The purpose of moving across these degrees is not to treat every movement in a lower timeframe as an independent confirmation.
A movement at a lower degree can provide evidence for the development of a higher-degree structure, but completion of a lower-degree structure alone cannot prove completion of the higher-degree structure. This distinction is particularly important in the current market condition because the higher-degree structure remains only partially resolved.
────────────────────────────────────────────────
3. Long-Term Structural Architecture — 3M Timeframe
The 3M timeframe defines the primary long-term framework of the current model.
The model begins from the historical reference identified as , recorded at April 1979 / $85.50, and the corresponding Alpha point identified at October 2002 / $0.40.
This reference serves as the time and price origin for measuring the current structure at the Cycle degree. Following this, the upward movement developed into a broad and multi-phase extension.
However, this point is not regarded merely as an ordinary price low; rather, it establishes the reference against which the subsequent long-term development is evaluated.
At the current stage, at the Cycle degree, only this initial structural point is regarded as confirmed. Its opposing point, , remains unresolved.
Therefore, two possibilities at the higher degree remain open:
(N.1)?
or
?
The question mark does not merely indicate uncertainty regarding the direction of movement. Rather, it indicates uncertainty regarding the structural identity of the future endpoint of the movement.
Therefore, this distinction is highly important. The current rise may represent the completion of a (N.1) structure at the Primary degree, or it may represent the continued development of Degree 4, namely .
Thus, the existing ambiguity is structural, rather than merely directional.
────────────────────────────────────────────────
4. Structural Boundaries and Time–Price Zones in the 3M Timeframe
The long-term price structure remains within a broad upward structural channel, while Fibonacci extension levels define the primary price boundaries.
Price levels already surpassed: 75% ← 78.6% ← 100%
The remaining extension levels are: 127.2% ← 150% ← 161.8% ← 200% ← 261.8%
These levels define the remaining price range within which the current structure may continue its extension or ultimately reach completion.
The time dimension creates a second set of structural boundaries:
2.618 → 3.618 → 5.0
Both dimensions, time and price, are measured relative to the origin .
The significance of this is that the completion of a structure in time becomes more analytically meaningful when time and price converge within a common zone, rather than when price merely reaches an individual Fibonacci level.
Therefore, the current condition in the 3M timeframe remains a multi-scenario Time–Price field, rather than a predetermined endpoint.
Figure 2 — 3M Time–Price Scenario Map for
────────────────────────────────────────────────
5. — Current Scenario Field
Three primary time windows remain active for the potential development or completion of :
Window 1 — 2.618 Window 2 — 3.618 Window 3 — 5.0
These time windows interact with the remaining price boundaries:
127.20% 150% 161.80% 200% 261.80%
The resulting structure is better regarded as a Time–Price search field within which the future may reach maturity.
As the market approaches one of these time and price zones, the corresponding structural scenario gains or loses significance according to price behavior within that zone. The market itself must gradually eliminate or reinforce the competing probabilities.
Therefore, the analysis intentionally preserves multiple scenarios until the interaction between price and time becomes sufficiently constraining to allow the identification of the endpoint of the higher-degree structure.
────────────────────────────────────────────────
6. Monthly Structural Decomposition — 1M Timeframe
The monthly timeframe decomposes the long-term upward movement into its internal structure at the Primary degree:
→ → → →
At the current position, two primary structural paths remain open.
Scenario A —
In this scenario, the current five-phase structure terminates with .
This completion raises the question of whether this movement simultaneously completes the higher-degree structure, namely (N.1), or whether it functions as an endpoint associated with .
Scenario B —
In this scenario, the current structure moves beyond and enters the following sequence:
← ←
After that, the remaining final phase also develops eventually.
This condition indicates that the structure at the Primary degree remains incomplete and requires further development before the endpoint at the higher degree can be determined.
This distinction makes the monthly structure one of the principal decision-making layers in the entire model.
The distinction between these two scenarios cannot be resolved solely through the monthly structure. The purpose of the monthly structure is to identify the competing structural paths that the lower degrees must subsequently decompose and resolve.
Figure 3 — Monthly Five-Phase Structure
────────────────────────────────────────────────
7. Monthly Seven-Phase Scenario
To examine the extension hypothesis, a secondary seven-phase scenario is retained in the monthly timeframe.
The purpose of this scenario is not to impose a seven-phase interpretation on the market, but to examine whether the current movement requires development beyond the standard five-phase completion.
Under this scenario, the continuation of the movement would proceed through the following sequence:
→ →
Under this scenario, each phase develops within its own approximate Time–Price range.
The most important temporal implication of this scenario is that, if the seven-phase structure remains valid, its completion could approach the 3.618 time boundary.
In such a case, the endpoint of the higher degree, , could also occur within the same time zone.
This convergence is analytically important because it connects the seven-phase scenario at the lower degree to a potential completion window at the higher degree.
Therefore, the seven-phase interpretation remains a conditional structural branch that becomes active only if the market fails to complete the current five-phase scenario and continues to develop further.
Figure 4 — Monthly Seven-Phase Scenario
────────────────────────────────────────────────
8. Continuous Double Corrective Structure — 1W Timeframe
In this section, the 1W timeframe examines Degree 2 of the structural hierarchy, and the analysis focuses on the current final branch, which begins from the completion of .
itself is the fourth phase of either a five-phase neutral structure or a seven-phase symmetrical structure previously identified and examined in the monthly timeframe.
Therefore, in the 1W timeframe, the analysis focuses on the fifth branch in order to determine what this branch is, how far it has developed, and whether the structure has reached completion or remains incomplete.
The identification and evaluation of the structural status of this branch constitute the primary focus of the analysis in this timeframe.
The active weekly sequence is identified as follows:
(N.1) → (L.1) → (N.2)
This configuration forms a continuous double corrective structure, in which (N.1) forms the initial component of the structure and has a seven-phase symmetrical character; (L.1) functions as the connecting structure and itself forms a five-phase neutral structure; and (N.2) is the current active branch, extending toward higher price levels.
This branch is currently incomplete and will be examined in greater detail through a zoomed analysis in the daily timeframe.
As shown in the chart inserted below, the potential area of further expansion and development in both time and price has been marked hypothetically.
At the current stage, from a price perspective, (N.2) is positioned at the 0.5 Fibonacci ratio, measured relative to (N.1).
More precisely, the current price is positioned at 50% of the price of (N.1).
Figure 5 — Weekly Continuous Double Corrective Structure
────────────────────────────────────────────────
9. Daily Structural Development — 1D Timeframe
In this section, the 1D timeframe examines Degree 1 of the structural hierarchy, with the analysis focused on the third component of the corrective double structure, namely (N.2).
The current sequence of this structure is identified as:
α → β → γ → δ → ω
The primary focus of the analysis is the active structure (N.2).
Within this branch, the market is developing a standard five-phase neutral structure and is currently still in phase γ, meaning the third phase of a five-phase structure.
Since γ has not yet been completed, the daily structure has not yet reached its terminal sequence.
To complete this structure, following the completion of γ, the next two phases, δ and ω, must develop sequentially.
Consequently, the continued development of γ, followed by the formation of δ and ω, is important for resolving the weekly structure (N.2) and may ultimately contribute to the identification and evaluation of structural scenarios at the monthly timeframe.
In the image below, hypothetical Time–Price zones for γ, δ, and ω have been drawn.
These zones are by no means certain or predetermined, nor have they been drawn randomly. Rather, they have been designed on the basis of structural proportions and the potential relationships that a standard five-phase structure may produce under its structural rules and principles, so that the potential development ranges of each branch can be visualized in both the time and price dimensions.
Accordingly, the current purpose of this image is simply to serve as a roadmap. The actual path of structural development must be confirmed or rejected on the basis of future market behavior and structural evidence.
In the next timeframe, the analysis will focus on this same branch ω. Its internal structure will then be examined in greater detail to determine what structural form it has, how far it may potentially develop, and whether it has reached completion or remains incomplete.
Figure 6 — Daily Five-Phase Structural Development
────────────────────────────────────────────────
10. Decomposition of the Third Branch of the Daily Structure — 4H Timeframe
In this section, the 4H timeframe provides the nearest structural decomposition relative to the current market price, with the analysis focused on the third branch of the daily structure.
This branch, identified as γ in the daily timeframe, is decomposed at this degree in greater detail to determine its internal architecture and degree of development.
The current sequence in the 4H timeframe is identified as:
P.a → v.β → P/Pc.c
Within this structure, the active branch is divided into three primary components:
First branch: a structure consistent with a standard impulse structure, forming the initial component of the sequence.
Second branch: a corrective structure displaying the characteristics of a standard five-phase neutral structure.
Third branch: the current active and developing component, which at present represents the last unresolved portion of the structure.
Based on this configuration, the primary question at this degree is whether these three components, taken together, can form a larger corrective structure of the zigzag type.
This interpretation is currently conditional and is not accepted merely on the basis of visual similarity. Rather, its validity must be determined through the internal development of the third branch and its interaction with the defined price, structural, and time boundaries.
Therefore, the third branch is the determining component of this structure.
Its completion will determine whether the entire three-part sequence can ultimately be classified as a valid zigzag, or whether, as new evidence emerges, the structure will require reassessment and reclassification.
Figure 7 — Four-Hour Three-Branch Structural Architecture
In the current condition, the 4H structure provides a conditional zigzag scenario whose validity has not yet been finalized.
The determination of this scenario depends on the development of the third branch and the extent to which it conforms to the constraints defined by price, structure, and time.
Consequently, the continuation of this structure will be determined through the development of the third branch and the testing of its validation conditions, which are examined independently in the following section.
Figure 8 — Conditional 4H Zigzag Scenario
────────────────────────────────────────────────
11. Zigzag Validation Conditions — 4H Timeframe
The validity of the zigzag structure at this degree is directly dependent on the development of the third branch.
This branch can remain structurally valid within the current scenario only if it simultaneously respects the defined price constraints, structural boundaries, and time range.
Price Condition:
The defined price threshold for the third branch is:
$250.77
The third branch must develop above $250.77 while at the same time remaining below the primary resistance boundary identified on the chart.
If price reaches or breaks through the prohibited resistance before reaching the corresponding time boundary, the current zigzag scenario becomes invalid and the structure must be reassessed and, if necessary, reclassified.
Time Condition:
From a temporal perspective, the third branch has two structural constraints.
The minimum time required for its development is defined by the 1.0 time ratio, corresponding to the duration of the first branch.
In contrast, the maximum permitted duration is determined by the combined duration of the previous two branches.
Therefore, the third branch not only requires a minimum amount of time to reach structural maturity, but must also determine its structural outcome before crossing the maximum temporal boundary.
As a result, the validation framework for the zigzag at this degree rests on four primary components:
Price condition + Structural boundary + Minimum time + Maximum time
Only when these conditions remain simultaneously satisfied will the current interpretation be maintained as a valid zigzag.
Otherwise, if market behavior changes or any of the defined boundaries is violated, the validity of the scenario will be called into question and the structure must be reassessed.
Figure 9 — 4H Zigzag Validation
────────────────────────────────────────────────
12. Integrated Structural Assessment
The current multi-degree structure, from the 3M timeframe through the 4H timeframe, presents a continuous and interconnected structural hierarchy in which, at each degree, the higher-degree structure is decomposed and constrained in greater detail.
At the Cycle degree, the identity of the opposing endpoint, namely , remains unresolved. Therefore, the 3M structure remains within a Time–Price scenario field, with the time windows 2.618, 3.618, and 5.0 and the price range from 127.20% to 261.80% serving as the principal boundaries for potential development.
At the Primary degree, this broader field is reduced to two principal structural paths: completion of the five-phase structure or continued development in the form of a seven-phase structure.
The weekly structure transfers this ambiguity one degree lower and connects the current movement to (N.2) within a continuous double corrective structure.
The daily timeframe then decomposes this same branch into a standard five-phase neutral structure, which is currently at γ and has not yet reached its terminal sequence.
At the lowest degree examined, the 4H timeframe decomposes the γ structure into a three-part sequence which, based on its current architecture, allows a conditional interpretation as a zigzag.
However, this classification will only be maintained if the third branch can simultaneously satisfy the requirements of price, structure, and time.
Therefore, the validity of this interpretation remains dependent on the future behavior of this same branch and its passage through the defined boundaries.
Overall, the evidence obtained from the lower degrees does not yet prove completion of the higher-degree structure. Rather, by progressively constraining the probabilistic space, it enables a more precise assessment of the remaining scenarios.
From this perspective, the model does not provide a fixed price target or predetermined endpoint. Instead, it follows a process of structural identification, validation, and, when necessary, reclassification, in which each degree provides the information required to progressively resolve the higher degree.
────────────────────────────────────────────────
13. Forward Structural Roadmap
The current structural roadmap can be viewed as a hierarchical sequence that begins at the Cycle degree and, by moving toward the lower degrees, progressively decomposes and constrains the unresolved structure:
3M
→ Endpoint of the higher-degree structure remains unresolved
↓
1M
→ or continued development toward →
↓
1W
(N.1) → (L.1) → (N.2)
↓
1D
α → β → γ → δ → ω
↓
4H
Three-branch development → Conditional zigzag scenario
↓
Validation
$250.77 + Resistance boundary + Minimum and maximum time
This roadmap does not represent a predetermined path for future market movement. Rather, it illustrates the current sequence through which the structure is being resolved across the different degrees.
At each stage, the lower-degree structure must provide the evidence required to evaluate the higher-degree structure, without completion of a lower-degree structure alone implying completion of the higher-degree structure.
Therefore, the significance of the current market condition cannot be reduced to a simple directional forecast.
The central question is whether structural development across the lower degrees can, while preserving the constraints of time, price, and structure, progressively narrow the space of competing scenarios and provide sufficient evidence to identify and validate the higher-degree structure or not.
Within this framework, each new movement is evaluated not merely as a continuation or reversal in price, but as evidence for maintaining, strengthening, weakening, or reclassifying the structural scenario.
────────────────────────────────────────────────
14. Final Structural Conclusion
Cheniere Energy is currently approaching a structural decision point; a point at which time, price, and the internal development of structures must interact with one another so that the identity of the higher-degree structure can be established with greater confidence.
In the 3M timeframe, remains unconstrained to a single final location, and multiple Time–Price zones remain as potential areas for structural development or completion.
In the monthly timeframe, two primary paths remain valid: completion of the five-phase structure or continued development in the form of a seven-phase structure.
In the weekly timeframe, this ambiguity is transferred into a continuous double corrective structure and linked to (N.2).
In the daily timeframe, this same branch is developing as a standard five-phase neutral structure and remains in phase γ.
Finally, the 4H timeframe represents the nearest structural layer to the current market price and provides the opportunity to directly examine the internal architecture of the third branch and test the conditional zigzag hypothesis.
Accordingly, the current condition cannot be classified as a confirmed completion of the higher-degree structure.
What is currently developing is a conditional structural transition, in which evidence from the lower degrees must progressively constrain the space of competing scenarios.
At the lowest degree examined, the validity of the zigzag scenario depends on the development of the third branch and its simultaneous adherence to the price condition, structural boundary, and temporal constraints.
A move above $250.77, provided that price remains below the defined resistance boundary and respects the required time range, may strengthen this interpretation. Conversely, violation of any of these conditions at any degree reduces the validity of the scenario at the corresponding degree and creates the need for reassessment or reclassification of the structure at the degree in which the violation occurs.
The same principle applies at the higher degrees.
Evidence obtained from the lower timeframes must not predetermine the endpoint of the structure; rather, it must determine whether the current movement ultimately leads to the completion of (N.1), forms , or requires further structural development before its final identity can be established.
Therefore, the final conclusion of this analysis is not a fixed price target or predetermined reversal point. Rather, it is a progressive process of structural identification, validation, and, when necessary, reclassification.
Within this framework, each timeframe provides part of the evidence required to resolve the higher degree, and the final structural identity can only be approached when time, price, and structural behavior converge sufficiently within a common area.
────────────────────────────────────────────────
 Long
Long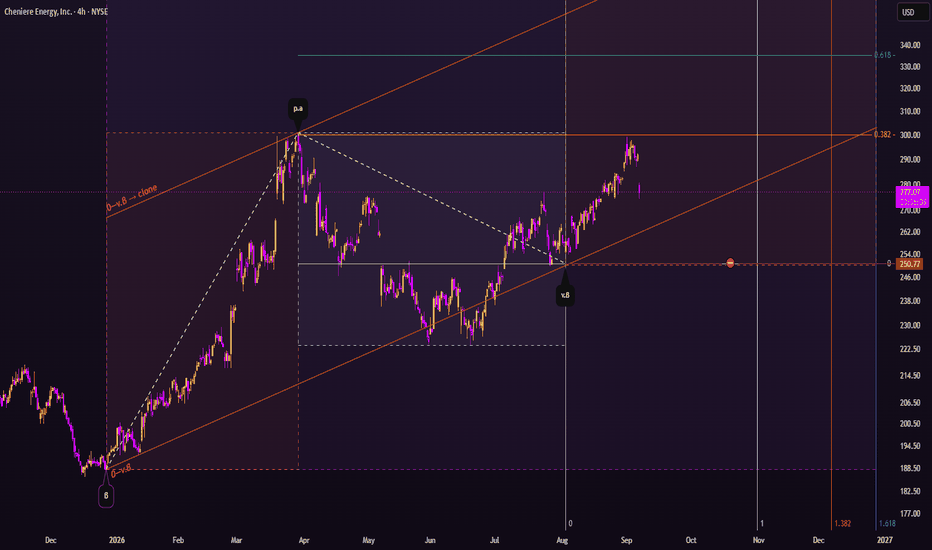
Short 
 Short
Short
BTC Lost 79,318 And Is Sitting On 78,028.BTC Lost 79,318 And Is Sitting On 78,028.
BTC lost the 79,318 shelf over the long weekend and is trading at 78,272, directly on the 78,028 line it reclaimed in early September. The compression that built into the weekend has expanded, and it expanded down - range expansion, volatility expansion, elevated volume and a swept swing low are all active on the hourly, and hourly conviction has collapsed to the bottom of its range. The 4H reads the opposite, sitting at the top of its own range, so the two timeframes are as far apart as they get. Neutral.
Resistance: 79,318 - the shelf it just lost
Key resistance: 80,497 - then the 82,283 high
Current price: 78,272
Support: 78,028 - the line directly under price
Key support: 77,436 - the overnight low
Structural floor: 74,182 - deeper support
Two paths from here:
It holds 78,028 and reclaims 79,318. Holding the line and closing back above the lost shelf makes this a weekend flush into support, and 79,875 then 80,497 come back into view. The 82,283 high stays the ceiling over all of it.
It loses 78,028. A break of the line opens the 77,436 low, and under that there is no real shelf until 74,182. That is where a pullback stops being a pullback.
The expansion is live and the two timeframes point in opposite directions, which is a reason to watch the level rather than pick the side. 79,318 to repair it, 78,028 to lose it.
Built with SYNTHESIS v3.3 | SOM / ACE / IMP / SYNTHESIS
Study, not financial advice. SPY Is Back Mid-Range At 768.30 Under The 771.43 Ceiling.SPY Is Back Mid-Range At 768.30 Under The 771.43 Ceiling.
SPY comes into the week back inside the two-week range, about three points under the 771.43 ceiling it failed to hold on Friday and about three points above the 765.52 level that decides whether that failure turns into a reversal. Neither side has been tested since. The two timeframes disagree - the 4H reads long with live conviction near 69 while the hourly is neutral near 39 and has just swept a swing low - and the 4H is in extension mode with volatility in the 80th percentile, which is a stretch condition, not a direction. Neutral.
Resistance: 771.43 - the lost ceiling, the reclaim level
Key resistance: 773.82 - then the 775.30 high
Current price: 768.30
Support: 765.52 - the level that decides the reversal
Key support: 762.57 - the next shelf under it
Structural floor: 759.13 - the range low
Two paths from here:
It reclaims 771.43 and holds it. A decisive close back above the ceiling turns Friday's failure into a shakeout and puts 773.82 and the 775.30 high back in play. Until that close prints, the ceiling sits above price and does the work.
It loses 765.52. A close below that level turns the failed breakout into a real reversal and opens 762.57, with 759.13 the range low beneath it. That is the level that changes the structure, not the drift at 768.
Two clean levels, three points either side of price, and a conviction surface that disagrees with itself across timeframes. 771.43 to fix the break, 765.52 to confirm it.
Built with SYNTHESIS v3.3 | SOM / ACE / IMP / SYNTHESIS
Study, not financial advice. NVDA Is Back Above 231.39 After The 234.76 High Failed.NVDA Is Back Above 231.39 After The 234.76 High Failed.
NVDA is trading at 231.47, back above the 231.39 line it closed under on Friday, after printing a new high at 234.76 and giving the entire move back in one session. The 229.14 shelf held through that fade, so the structure under price is intact. Conviction is not confirming the recovery - both timeframes read neutral with live readings in the mid-40s, participation and extension conditions are empty on both, volume sits in the 1st percentile on the 4H, and the 4H still carries a high-swept flag from the failed high. Neutral.
Resistance: 232.48 - the level cleared Friday before the fade
Key resistance: 234.76 - the new high that did not hold
Current price: 231.47
Support: 229.14 - the shelf that held the fade
Key support: 227.11 - then 226.52 under it
Structural floor: 222.43 - deeper support
Two paths from here:
It holds 231.39 and works back toward the high. Clearing 232.48 and holding it reopens 234.76 and makes Friday's fade a one-session digestion. The shelf at 229.14 is the floor under that attempt.
It loses 229.14 and the failed high becomes the story. A close below the shelf opens 227.11 and 226.52, and the 234.76 print reads as an extension that could not hold. Below 229.14 the whole late-week push is given back.
The high is made and unheld, the shelf is intact, and conviction is flat on both timeframes with no volume behind the recovery. 232.48 to resume it, 229.14 to lose it.
Built with SYNTHESIS v3.3 | SOM / ACE / IMP / SYNTHESIS
Study, not financial advice.  Short
Short
Natural Gas: Decoding the Next Major Move — 3M | 1M | 1D | 4HNatural Gas: Decoding the Structural Architecture Behind the Next Major Move
An Integrated Time–Price Analysis of NG1! Across 3M, 1M, 1D and 4H Timeframes
1. Structural Thesis
Natural Gas Futures (NG1!) currently present a long-term structural configuration extending from the earliest available price data in April 1990 to the latest recorded price of $2.881 on 30 August 2026. Across the 3M, 1M, 1D and 4H timeframes, the market develops through a hierarchical structural sequence in which each lower timeframe decomposes the most recent structurally meaningful segment identified at the higher degree.
The analysis begins with the 3-month timeframe to establish the primary structural architecture. The monthly timeframe then isolates the internal development of the terminal macro phase, while the daily and 4H timeframes progressively resolve the declining structure currently associated with the unresolved ? phase.
The central question is therefore no longer the existence of the broader structure, but whether the most recent decline has completed the current phase and activated the next structural expansion, .
That determination remains conditional upon the interaction of Price, Time, and Structural Confirmation. The current low is therefore treated as a structural hypothesis rather than a confirmed terminal point until the required reversal conditions are satisfied.
2. Analytical Framework and Structural Notation
The analytical sequence follows a strict top-down hierarchy:
3M → 1M → 1D → 4H
The 3M timeframe establishes the primary long-term structure. The 1M timeframe decomposes the current last phase.The 1D timeframe decomposes the current , which is the fourth phase of , at the fourth degree, And the 4H timeframe analyzes and examines the fifth phase of , labeled (ω).
The Weekly timeframe is intentionally excluded. The structurally meaningful segment identified at that level does not contain sufficient wave development to justify a further decomposition, so the analysis transitions directly from Monthly to Daily.
Structural Notation
To preserve the identity of each structural degree, the labels are intentionally maintained and are not treated as interchangeable:
3M | Fifth Minuette | → → → →
1M | Fourth Subminuette | → → → ? →
1D | Third Micro | (α) → (β) → (γ) → (δ) → (ω)
4H | Second Submicro | α → β → γ → δ → ω
The similarity of the names across degrees is intentional. The distinction is established by the structural degree and timeframe in which each label is used.
Accordingly, , , and (δ) should not be interpreted as the same structural object. Each belongs to a different degree within the hierarchy.
3. Historical Structural Architecture — 3M
The long-term Natural Gas structure is defined by four major structural turning points, which establish the framework for a fifth and final phase. From the beginning of the recorded price series to the present, the 3M timeframe identifies two major highs and two major lows.
— $4.61 | October 1996
The first major structural high was established at $4.61. From the beginning of the recorded price series, 26 quarterly bars elapsed, corresponding to approximately 6 years and 6 months.
This establishes the first major phase of the long-term structure at the fifth Minuette degree.
— $2.12 | January 2000
The first major structural low was established at $2.12. The interval from Alpha to Beta contains 13 quarterly bars, equivalent to approximately 3 years and 3 months.
— $13.694 | July 2008
The second major structural high was established at $13.694. From Beta to Gamma, 34 quarterly bars elapsed, corresponding to approximately 8 years and 6 months.
— $1.44 | April 2020
The second major structural low was established at $1.44. From Gamma to Delta, 47 quarterly bars elapsed, equivalent to approximately 11 years and 9 months.
These four structural vectors establish the long-term standard neutral five-phase configuration:
→ → → →
The current market position therefore represents the development of the fifth and final phase, .
4. Long-Term Structural Boundaries — 3M
The macro structure is contained between two principal structural boundaries.
Alpha–Omega Resistance
The upper structural boundary is defined by the relationship between the high and the recorded peak of the phase. This line represents the principal long-term resistance boundary of the formation.
Beta–Delta Support
The lower structural boundary is defined by the low and the absolute low. This line represents the principal long-term support boundary.
Together, these two boundaries define the structural range within which is developing. The broader configuration remains consistent with a five-phase neutral structure, with representing its terminal phase.
The next level of analysis therefore shifts from the macro structure to the internal architecture of .
5. Time–Price Architecture of the Long-Term Structure — 3M
The 3M structure provides a Time–Price framework for comparing the established phases in both duration and price development. The principal relationships include β/α, γ/α, δ/β, δ/γ, projected γ/α timing, and the hypothetical ω/γ relationship.
These relationships are used to evaluate how the duration and magnitude of each structural phase compare with structurally related phases. Their purpose is not to generate an independent forecast, but to establish proportional references against which the development of the contracting phase can be evaluated.
6. Structural Decomposition — 1M
The monthly timeframe isolates the internal architecture of the long-term phase.
At the fourth Subminuette degree, develops as a contracting five-phase structure:
→ → → ? →
— $9.39
September 2022
The first major high of the contracting structure was established at $9.39.
— $2.50
November 2024
The first major low followed at $2.50.
— $7.40
January 2026
The second major high was established at $7.40.
? — approximately $2.80
The current phase has declined toward approximately $2.80. Its completion, however, has not yet been conclusively confirmed. It therefore remains designated ?.
The unresolved structural question at this degree is whether the current decline represents the completed fourth phase of the contracting formation and consequently opens the path toward the final phase.
Contracting Structural Boundaries
The contracting formation is defined by two converging boundaries:
Upper Boundary — –
A descending resistance line connecting the highs of and .
Lower Boundary — –
A sloping support line connecting the low of with the current low region.
These two boundaries define the contracting architecture in which the unresolved ? phase is developing.
7. Time–Price Structure of — 1M
The projected phase is constrained by both price and time. The model incorporates Fibonacci price references and a critical Non-Violation Zone, whose violation would invalidate the current contracting interpretation. The temporal framework is defined by the 0.382, 0.50, 0.618, 0.786, and 1.000 ratios, with 1.618 representing the upper permissible temporal boundary for the projected wave.
This establishes the conditions under which the monthly ? can either mature into a confirmed terminal phase or be invalidated by structural violation.
8. Structural Decomposition — 1D
The daily timeframe decomposes the current structure, which is the fourth phase of Vector Omega at the fourth degree, into a five-phase reversal structure at the third Micro degree.
The internal sequence is:
(α) → (β) → (γ) → (δ) → (ω)
(α) — approximately $2.77
February 2026
The initial declining leg from the high completed at approximately $2.77.
(β) — approximately $3.31
March 2026
The first corrective advance reached approximately $3.31.
(γ) — approximately $2.50
April 2026
The principal low of the declining sequence formed at approximately $2.50.
(δ) — approximately $3.35
July 2026
The second corrective advance reached approximately $3.35.
(ω) — approximately $2.69
August 2026
The final declining leg reached approximately $2.69.
This sequence is interpreted as a potential completion of the broader structure, which constitutes the fourth phase of Vector Omega at the fourth degree, through a five-phase reversal structure at the third Micro degree. However, confirmation has not yet been achieved, so the higher-degree structure remains designated ?.
The daily configuration is bounded by two structural lines:
Upper Boundary — (β)–(δ)
A descending resistance line connecting the two corrective highs.
Lower Boundary — (α)–(ω)
A descending support line connecting the structural lows.
Together, these lines define the internal reversal channel of the Micro-degree structure.
9. Time–Price Relationships Within — 1D
The daily timeframe provides seven internal Time–Price relationships:
β/α, γ/α, δ/β, δ/γ, ω/α, ω/γ, and ω/δ.
These relationships compare the duration and price development of the Micro-degree phases and help evaluate how the final (ω) leg relates proportionally to the preceding structure. No individual ratio is treated as an independent confirmation of the contracting low; rather, the combined proportional relationships provide additional structural context for assessing whether the observed decline is consistent with a completed reversal sequence.
10. (ω) Structural Decomposition — 4H
The 4H timeframe provides the most immediate structural resolution of the current market position.
At the second Submicro degree, the structure under examination is the internal Omega sequence:
α → β → γ → δ → ω
α — $2.85
14 July 2026
The first declining leg from the high of the Delta phase at the Micro degree completed at $2.85.
β — $2.99
23 July 2026
The first corrective upward leg reached $2.99.
γ — $2.62
6 August 2026
The principal price low within the declining sequence formed at $2.62.
δ — $2.87
19 August 2026
The second corrective upward leg reached $2.87.
ω — $2.69
25 August 2026
The final declining leg completed at $2.69.
The sequence presents a complete-looking five-phase decline. However, the importance of the final low extends beyond the Submicro structure itself.
Its confirmation would imply:
completion of the Micro-degree (ω) → completion of the broader Subminuette
For that reason, the 4H structure remains marked ? until the higher-degree reversal condition is activated.
The internal configuration remains contained within a descending reversal channel:
Upper Boundary — β–δ
Lower Boundary — α–ω
These boundaries define the Submicro-degree reversal structure under observation.
11. Time–Price Relationships — 4H
The 4H structure provides the immediate Time–Price framework for evaluating the maturity of ?. Its principal relationships are β/α, γ/α, δ/β, δ/γ, ω/α, and ω/γ.
These relationships describe the temporal and price proportions of the Submicro-degree reversal sequence and provide additional evidence for evaluating the development and maturity of the current structure. The analysis then shifts from proportional assessment to the explicit structural confirmation and invalidation conditions defined by Price and Time.
The analysis now shifts from structural identification to structural confirmation.
12. Structural Confirmation and Invalidation — 4H
The current structural hypothesis remains conditional upon the joint validation of Price and Time.
Price Confirmation
The critical structural boundary is:
$3.35
A confirmed upside break above $3.35 would retrace the entire Micro-degree Omega decline and provide the structural evidence required to confirm completion of .
Until this level is decisively reclaimed, the current $2.69 low remains a structural hypothesis rather than a confirmed terminal point.
Temporal Confirmation
The reversal must also develop within the established temporal boundaries:
0.5 Temporal Boundary — 17 September 2026
1.0 Temporal Boundary — 12 October 2026
These boundaries define the expected temporal maturity of the current structure. The confirmation condition is therefore:
Price > $3.35 + Upside Break Before 12 October 2026
When this condition is satisfied, the low of is confirmed and the next structural phase is activated:
→
Conversely, if the reversal fails to establish itself before the final temporal boundary of 12 October 2026, the present reversal hypothesis loses validity and the second-degree structure must be reassessed or redefined.
The two components therefore serve different functions:
$3.35 determines structural confirmation.
The temporal boundaries determine whether that confirmation occurs within the expected structural maturity.
13. Time–Price Convergence and Conditional Scenario
Once is confirmed, the subsequent development of is governed not only by the price breakout itself, but also by the timing of that breakout.
An earlier recovery through $3.35 implies greater temporal acceleration and therefore a greater potential for expansion toward higher price horizons. A later recovery leaves less temporal capacity for the subsequent structure and correspondingly reduces its potential range.
The relationship can therefore be expressed as:
Earlier Breakout
→ Greater Temporal Acceleration
→ Greater Upside Potential
Later Breakout
→ Lower Temporal Acceleration
→ More Limited Upside Potential
The activation of therefore depends on both whether $3.35 is reclaimed and when that recovery occurs within the established temporal window.
Once the structural and temporal conditions are satisfied, the conditional Fibonacci objectives associated with become active:
0.382 — approximately $3.90
First Structural Objective
The initial upside station following confirmation.
0.618 — Primary Hypothetical Objective
The principal projected objective. Its relevance depends directly on the temporal acceleration of the breakout.
0.786 — approximately $5.90
Secondary Expansion Objective
A higher structural horizon that becomes relevant if the reversal develops with sufficient momentum and temporal efficiency.
1.000 — approximately $7.30
Terminal Price Boundary
The upper boundary of the current hypothetical upside model.
These levels are conditional structural objectives, not fixed forecasts. Their activation requires confirmation of together with a valid upside break above $3.35.
[FIGURE 8 — Conditional Upside Objectives]
14. Integrated Structural Sequence
The entire analysis can now be represented as a continuous structural hierarchy:
3M — Macro Architecture
→ → → →
↓
1M — Internal Architecture of
→ → → ? →
↓
1D — Internal Architecture of ?
(α) → (β) → (γ) → (δ) → (ω)
↓
4H — Immediate Internal Architecture
α → β → γ → δ → ω
↓
Confirmation Mechanism
$3.35 + Temporal Validation
↓
Conditional Activation
→
This hierarchy is important because the lower-degree structures do not independently confirm the higher-degree terminal point. Instead, they progressively establish the structural evidence required for a higher-degree confirmation. The final confirmation therefore occurs only when the lower-degree reversal develops sufficiently to reclaim the decisive higher-degree boundary.
15. Final Structural Assessment
Natural Gas is currently positioned at a critical decision point within its long-term structural architecture.
The 3M chart identifies a five-phase neutral configuration, with representing the fifth and final macro phase.
Within , the 1M timeframe presents a contracting five-phase configuration whose fourth phase, ?, has reached a potentially terminal region.
The 1D and 4H structures both resolve into declining five-phase sequences, with the latest low established around $2.69. These lower-degree structures provide the basis for considering the current decline potentially complete, but they do not independently confirm the higher-degree termination.
The decisive confirmation level remains:$3.35
A successful recovery and breakout above this level, within the established temporal boundaries, would confirm the completion of and activate the next structural phase:
The principal temporal boundaries are:
17 September 2026 — 0.5
12 October 2026 — 1.0
Following confirmation, the conditional upside structure extends through the projected Fibonacci price horizons of approximately:
$3.90 → $5.90 → $7.30
with the magnitude of the move conditioned by the temporal speed of the initial breakout.
The market therefore remains in a conditional transition state: ? → Confirmation above $3.35 → Activation → Time-Dependent Upside Expansion
Until that confirmation occurs, the current low remains a structural hypothesis rather than a confirmed terminal point.The analytical framework therefore does not define a fixed directional forecast. Instead, it defines a conditional structural pathway in which Price determines confirmation, Time determines structural maturity, and the convergence of both determines the potential development of the next phase.  Long
Long
Trading's Toughest Battle Happens in Your MindMost traders spend years learning technical analysis, studying chart patterns, tracking market news, and searching for the perfect strategy. However, many eventually discover that having a good strategy is only one part of becoming successful. The real challenge often begins when money is at risk and emotions start influencing decisions.
Trading is not just a test of market knowledge. It is also a test of patience, discipline, self-awareness, and emotional control. A trader may know exactly what they should do, but knowing and actually doing it consistently are two very different things.
This is why trading psychology is so important. It is not simply about controlling fear and greed. It is about understanding the hidden thoughts and emotional reactions that influence every decision we make in the market.
The Market Is More of a Mirror Than an Opponent:
Traders often speak about the market as if it were a personal opponent. You may hear someone say, “The market trapped me,” or “The market took my stop-loss.” While these reactions are understandable, the truth is that the market has no personal interest in any individual trader.
The market does not know where you entered a trade, how much money you invested, or what you expected to happen. What it does reveal, however, is how you react when things do not go according to your expectations.
A losing trade may expose your difficulty in accepting that you were wrong. A missed opportunity may reveal your fear of regret, while a winning streak may bring out overconfidence. In many ways, the market acts like a mirror by exposing emotional habits that might otherwise remain hidden.
The moment a trader stops asking, “Why did the market do this to me?” and starts asking, “Why did I react this way?” their approach to trading begins to change. That simple shift in thinking can lead to much greater self-awareness.
The Dangerous Need to Be Right:
One of the biggest psychological problems in trading is the need to be right. In everyday life, being correct is often associated with intelligence and competence. Naturally, people do not enjoy admitting that they made a mistake.
In trading, however, this mindset can become extremely expensive. Imagine a trader buying a stock at $100 with the belief that the price will rise. Instead, the stock begins falling, but the trader refuses to exit the position.
Selling the stock would mean accepting that the original prediction was wrong. Rather than managing the trade objectively, the trader may continue holding the position simply to avoid admitting a mistake.
At that point, the trade is no longer about market analysis. It becomes a battle between the trader and their own ego.
Successful traders understand that they do not need to be right all the time. What matters more is knowing how to manage risk when they are wrong. A trader can lose several trades and still remain profitable if losses are controlled and winning trades are managed properly.
The market does not reward people for being right. It rewards those who survive long enough and manage risk effectively.
Revenge Trading Is Often an Emotional Response:
Revenge trading usually happens after a painful loss. A trader loses money and immediately feels the urge to enter another position, hoping to recover the loss as quickly as possible.
However, the deeper problem is often not the financial loss itself. A losing trade can create feelings of frustration, embarrassment, anger, or helplessness. The trader may enter another trade because they want to remove those uncomfortable emotions.
In this situation, the next trade is not based entirely on a high-quality setup. The trader is unconsciously hoping that making money will repair the emotional damage caused by the previous loss.
This is why revenge trading can be so dangerous. The trader is no longer focused on probability, risk, or market conditions. They are searching for emotional relief inside an environment that offers no guarantees.
Sometimes, the most professional decision after a significant loss is to step away from the screen. Taking a break does not mean a trader is weak. It simply creates enough distance to prevent emotions from being mistaken for logical analysis.
When the P&L Starts Controlling Your Decisions:
Another common psychological problem is becoming too focused on profit and loss. A trader may enter a position with a clear plan, including an entry point, stop-loss, and target. Everything appears organized before the trade begins.
However, once the position starts moving, attention can quickly shift from the chart to the profit and loss number. The trader begins watching every small increase and decrease in their account.
When the trade moves into profit, excitement appears. When profits start decreasing, fear can take over. The trader may close a good position too early because they are afraid of losing unrealized gains.
The opposite can happen with a losing position. Instead of accepting a planned loss, the trader may continue holding because closing the position would make the loss feel real.
The important thing to remember is that the market does not know your P&L. Price does not care whether you are currently making money, losing money, or sitting at break-even.
Monitoring profits and losses is important for risk management, but allowing every fluctuation to influence your emotions can lead to poor decisions. Strong traders learn to focus more on the quality of their decisions than on the emotional impact of every number changing on the screen.
Boredom Can Be Just as Dangerous as Fear:
Fear and greed receive most of the attention when people talk about trading psychology. However, boredom is another powerful emotion that many traders underestimate.
A trader may spend several hours watching the market without finding a valid setup. At first, they remain patient, but after a while, doing nothing begins to feel uncomfortable.
Eventually, the trader may start searching for reasons to enter the market. A weak setup suddenly looks interesting, or a random price movement begins to appear like an opportunity.
This is where unnecessary trading often begins. The trader does not enter because the market has provided a strong opportunity. They enter simply because they are tired of waiting.
In many careers, being active creates progress. Trading is different. Sometimes doing nothing is the best possible decision.
The ability to remain patient when no opportunity exists is a genuine trading skill. Not every movement in the market deserves your attention, and not every day requires a trade.
Sometimes, the best trade is the one you decided not to take.
Confidence Is Not the Same as Certainty
Many traders believe confidence means being completely certain about what the market will do next. However, certainty and confidence are not the same thing.
Certainty says, “This trade will definitely work.” Confidence says, “This trade may or may not work, but I know how I will manage the situation.”
That difference is extremely important because markets are based on probability, not guarantees. Even the strongest setup can fail, and even experienced traders cannot predict every market movement.
Real confidence comes from preparation. A confident trader knows how much they are willing to risk and understands the point at which their trading idea is no longer valid.
They also know that a single trade does not define their ability as a trader. The outcome is uncertain, but their approach to managing risk does not have to be.
True confidence is not about predicting the future perfectly. It is about being prepared for different possible outcomes.
Do Not Let Your Last Trade Control the Next One
One of the most common mistakes traders make is allowing their previous trade to influence the next decision. A large loss can make someone afraid to take another valid opportunity.
On the other hand, a large win can create excessive confidence. The trader may start taking bigger risks because they feel that they have finally understood the market.
Both reactions are examples of recency bias. This means giving too much importance to recent events while forgetting that every new trading opportunity should be evaluated independently.
The market does not care whether you lost yesterday or made a profit this morning. A new setup should be judged based on its own conditions, probability, and risk.
Winning streaks do not guarantee future success, and losing streaks do not guarantee future failure. Traders need to develop the ability to emotionally reset after each trade.
The goal is to make sure yesterday's emotions do not become today's decisions.
Discipline Begins Before You Enter the Trade
Many traders believe discipline is about controlling emotions while a trade is active. Although this is important, true discipline often begins before the trade is even placed.
It is much easier to make logical decisions when you are calm. Once real money is involved and the price begins moving quickly, emotional pressure increases.
This is why important decisions should be made before entering a position. A trader should already know how much they are willing to risk, where the trade becomes invalid, and what conditions would justify an exit.
When these decisions are made in advance, there is less room for emotions to interfere. The trader does not have to negotiate with themselves every time the market moves against them.
Good trading psychology is not only about having strong willpower. It is also about creating a process that reduces unnecessary emotional decisions.
The fewer important decisions you make under pressure, the easier it becomes to remain disciplined.
Do Not Build Your Identity Around Winning
A strong trading identity can sometimes create unexpected problems. If a person constantly thinks, “I am a successful trader,” every losing trade may feel like a personal attack on that identity.
The trader may begin defending bad positions because closing them would feel like admitting failure. Instead of evaluating the market objectively, they become emotionally attached to protecting their image.
A healthier mindset is to think of yourself as someone who follows a process. This creates a more stable relationship with both winning and losing.
You can follow an excellent process and still experience a losing trade. At the same time, you can follow a poor process and get lucky with a profitable outcome.
This is why judging yourself based on individual trades can be misleading. Trading performance should be evaluated over a large number of decisions rather than one win or one loss.
The goal is not to become a trader who never loses. The goal is to become someone who remains disciplined when losses happen.
The Real Goal Is Emotional Balance
The best traders are not completely emotionless. That would be unrealistic. Fear, excitement, regret, and frustration are natural human emotions.
The real goal is to avoid allowing these emotions to control every trading decision. A winning trade should not make you feel invincible, and a losing trade should not make you question your entire ability.
Both outcomes are temporary. Over time, they become part of a much larger collection of trading decisions.
Instead of constantly asking, “Did I win?” a trader can ask a better question: “Did I follow my process?”
Instead of focusing only on how much money was made during the day, they can ask whether they followed their risk management rules and avoided unnecessary trades.
This shift from outcome to process is one of the most valuable psychological changes a trader can make.
Final Thoughts: The Hardest Market to Master Is Your Own Mind
Technical analysis can be learned. Trading strategies can be tested, and market knowledge can be developed over time. However, managing your own thoughts and emotions is often a much longer process.
Fear will always exist. Greed will appear from time to time, and losses will always be part of trading. Even experienced traders can experience frustration, overconfidence, or regret.
The difference is not that successful traders never experience these emotions. The difference is that they learn to recognize them before those emotions take control of their decisions.
Markets will always be uncertain, and unexpected price movements will always happen. No strategy can eliminate risk completely.
However, when traders stop trying to control the market and start focusing on controlling their own responses, their perspective begins to change.
Trading becomes less about predicting every move correctly. Instead, it becomes about managing risk, following a process, and remaining emotionally stable in an uncertain environment.
In the end, the most important position a trader manages may not be on the chart at all.
It may be the position they hold within their own mind.
Education 
Long 
 Long
Long