XAUUSD — EMA Uptrend Holds, Buy From Value Zone
Fundamental Analysis
Gold is holding a stronger recovery structure as traders continue to watch USD momentum, Treasury yields, and upcoming U.S. macro data.
For now, the technical structure remains constructive while price holds above the rising EMA support zone.
Technical Analysis
On the 1H chart, XAUUSD is trading around 4,155 after a strong bullish recovery from the lower structure. EMA 34, EMA 89, and EMA 200 are starting to turn upward, showing that buyers are gaining control of the short-term trend.
Price is currently testing the EMA 34 area, which is also close to the Fibonacci and trendline value zone. This is an important area because a bullish reaction here may confirm that the market is preparing for another continuation move.
The key buy zone is around 4,136 - 4,152. This zone aligns with EMA 34, Fibonacci support, and the rising trendline structure.
If buyers defend this area, gold may continue toward the previous high around 4,202, then 4,221. A stronger breakout may open the way toward the Fibonacci extension target around 4,312.
Important Key Levels
Current price area: 4,155
Main buy zone: 4,136 - 4,152
EMA 34 reaction area: around 4,152
EMA support area: 4,107 - 4,136
Short-term resistance: 4,202
Breakout resistance: 4,221
Main upside target: 4,281 - 4,312
Invalidation area: below 4,101
Trading Scenario
Main Buy Scenario
Entry: 4,136 - 4,152
Stop Loss: 4,101
Take Profit 1: 4,202
Take Profit 2: 4,221
Take Profit 3: 4,281 - 4,312
Buy Condition
The preferred setup is to wait for gold to hold the 4,136 - 4,152 buy zone. This area is important because price is testing EMA 34 while still holding above the rising EMA structure.
A buy setup becomes more valid if price forms bullish rejection from this zone, such as a long lower wick, bullish engulfing candle, higher low formation, or a clean reclaim above 4,160.
If price holds above the buy zone and breaks 4,202, the bullish continuation view becomes stronger. The next upside targets would be 4,221, then 4,281 - 4,312.
Alternative Sell Scenario
Entry: below 4,101 after breakdown confirmation
Stop Loss: 4,136
Take Profit 1: 4,079
Take Profit 2: 4,040
Take Profit 3: 4,020
Sell Condition
This is not the main view. A sell setup should only be considered if gold breaks below 4,101 and fails to reclaim the EMA support structure.
If price loses the rising trendline and closes below the EMA value zone, the bullish setup becomes weaker and gold may retest lower liquidity areas.
Entry Conditions
Wait for price to react around 4,136 - 4,152.
Look for bullish confirmation before entering buy.
Do not chase price if it moves directly into resistance.
A break above 4,202 confirms stronger bullish momentum.
If price breaks and holds below 4,101, the buy setup is invalid.
Overall, the main view remains bullish while XAUUSD holds above the rising EMA structure. Price is now testing EMA 34, so the preferred plan is to wait for a clean reaction from 4,136 - 4,152 before looking for continuation toward 4,202, 4,221, and 4,281 - 4,312.
Do you share the same bullish view on gold, or are you waiting for a stronger confirmation above 4,202?
 Long
Long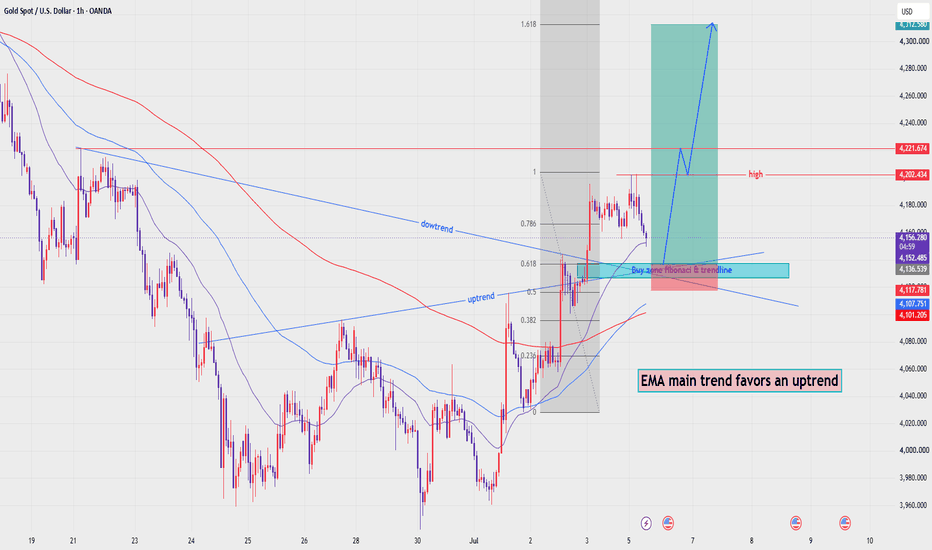
MASON XAUUSD – Gold Holds Bullish Structure At Weekly Open
XAUUSD is trading around 4,181 at the start of the week after holding above the recent breakout structure. Price remains inside the rising trendline channel and above the Ichimoku support area, so the short-term bias is still bullish.
The priority view remains buy on pullback, especially if gold retests the 4,172–4,177 buy order zone and continues to hold above the key support area.
Technical View
Gold is still showing a bullish structure after the strong recovery from the 3,960 area. The market has created higher highs and higher lows, which shows that buyers are still controlling the short-term direction.
Price is currently moving inside a rising trendline channel. This channel is important because it shows the path of the bullish momentum. As long as gold holds above the lower trendline, the upside structure remains valid.
Ichimoku also supports the bullish view. Price is trading above the Ichimoku structure, while the cloud and Ichimoku lines below price may now act as dynamic support. This means pullbacks are still healthier than chasing price at resistance.
The 4,172–4,177 area is the key buy order zone on the chart. If gold pulls back into this zone and forms bullish rejection, it may confirm another higher low before continuing higher.
The 4,155 area is the key support zone. If price stays above this level, buyers still have the advantage. A breakdown below 4,155 would weaken the bullish structure and may create a deeper correction.
The main upside target remains the psychological resistance zone around 4,270–4,280, which also aligns with the Fibonacci 2.618 extension area. This is the next major zone where price may react.
Key Zones
Current price: 4,181
Buy order zone: 4,172–4,177
Key support zone: 4,155
Ichimoku support area: 4,093–4,052
Short-term resistance: 4,190–4,200
Psychological resistance zone: 4,270–4,280
Fibonacci extension target: 2.618
Invalidation: below 4,155
Trading Plan
Buy Priority: 4,172–4,177
Condition: wait for bullish rejection, higher low formation, or price holding above the rising trendline and Ichimoku structure.
SL: below 4,155
TP1: 4,200
TP2: 4,240
TP3: 4,270–4,280
Alternative Scenario
If gold breaks above 4,200 directly, wait for a retest of this level as support before looking for continuation toward 4,240 and the psychological resistance zone.
Sell View
Sell is not the priority while price stays above the rising trendline, the buy order zone, and the Ichimoku structure. A sell setup only becomes safer if gold breaks below 4,155 and fails to recover back above the key support zone.
Final View
Overall, gold continues to hold a bullish structure at the start of the week. The cleaner plan is to wait for a pullback into the 4,172–4,177 buy zone instead of chasing price near resistance. If this zone holds, the next upside focus remains 4,200, 4,240, and 4,270–4,280.
Will gold retest the buy order zone first, or continue directly toward the psychological resistance area?
Long 
Aigensyn is at the bottomHello Traders!
After a massive win in Aigensyn we are entering again. We are again buying it from 0.027.
In chart we can see there is a breakout of a pattern but after breaking, Aigensyn is forming a reversal pattern which means it is going to push the price back inside the pattern. There are many more bullish confirmations in this pair.
We are buying Aigensyn from 0.027
Stoploss 0.02542(-5.7%)
Target 0.03270(+21.2%)
My goal is to be recognized as one of the highest win-rate traders in the TradingView community. :)
Trade Analysis Based on
> Fibonacci Tool (A1000x Way) – Custom Fibonacci approach for precise market analysis
> Candlestick Patterns – Strong price action confirmation through key candle formations
> A1000x Breakout Strategy – Identifying and trading high-probability breakout setups
> HH, HL & LH, LL Strategy – Market structure analysis for clear trend direction
> Swing Points – Tracking key highs and lows for accurate price movement insight
> A1000x Stoploss Strategy – Strategic stoploss placement for effective risk control
> A1000x Target Strategy – Structured target setting based on price action
We trade using carefully developed strategies and disciplined market analysis, always seeking the best possible accuracy while remembering that ultimate success comes only by the will of Allah.
In some trades, you may notice a relatively larger stop loss or a risk-to-reward ratio that may appear unusual at first glance. However, every trade is taken with proper planning and calculated analysis, not random entries.
Before entering any position, we perform detailed calculations and market evaluation. Based on this analysis, we carefully determine our stop loss and target levels.
I personally apply one of my specialized stop-loss and target strategies, designed to place the stop loss at a logical market level where price is less likely to reach before moving toward the intended target — InshaAllah.
Trading always involves risk, but with discipline, patience, and proper strategy, we aim for consistent and responsible decision-making.
Feel free to share your thoughts, leave a comment, or contact me.  Long
Long
SOLUSDT: Five-Month Trendline Meets POC ConfluenceThis trendline goes back to January. Every high since has come in lower than the last, and the line connecting them has capped every attempt at reclaiming the highs for five months straight. May's failed push to 97 rejected right off it.
Then June happened. Price broke down from 97 to a 60 low inside three weeks, the sharpest move on the chart, before reversing. That low held above the mid-February volume shelf, and the recovery since has been steady, not violent, climbing back into the same descending trendline that's rejected every prior test.
What's different this time: the trendline and the POC at 85 are converging at almost the same price. Price closed at 82.62, pressing directly into that confluence. This isn't PULLBACK into open air, it's a MOMENTUM leg running straight into the one level with five months of memory built into it.
Volume MA is flat, unremarkable, no signature push behind this approach. That matters here more than it did on the ETH setup. A trendline with this much history doesn't break on a quiet volume profile. It gets tested and it either fails again or it doesn't, and quiet volume favors the former until proven otherwise.
What invalidates the bullish case: rejection back below Range Low at 67.50 would undo the entire June recovery structure. What confirms it: a daily close above both the trendline and 85 POC together, not one without the other.
Epictetus said we're disturbed not by what happens, but by our opinion of what happens. Five months of lower highs is what happened. Whether 85 breaks is what the market opines next.  Long
Long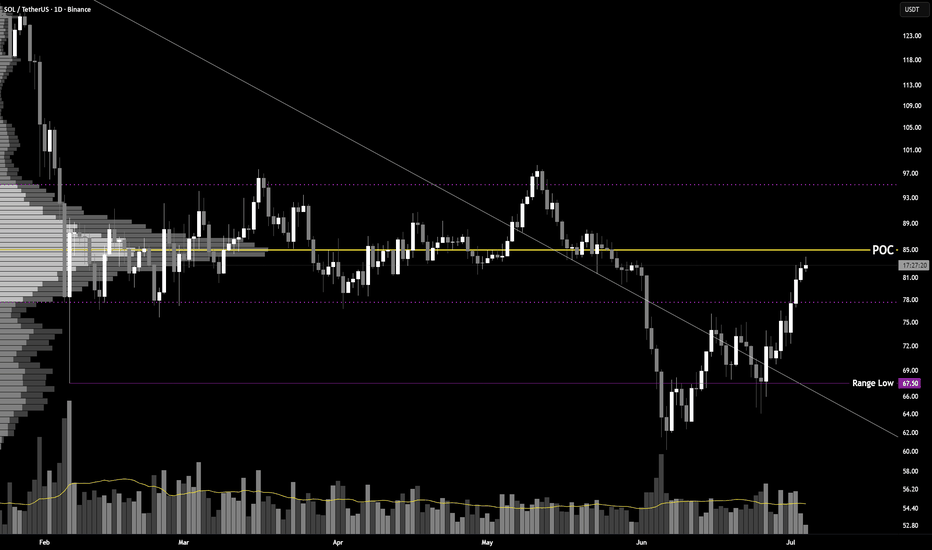
MASON XAUUSD – Gold Tests Trendline And Ichimoku Value Area
XAUUSD is trading around 4,175 after a strong recovery from the recent support zone. However, the bullish structure has not been fully confirmed yet because price is now testing the descending trendline and the Ichimoku value area.
For next week, the priority view is to watch for sell confirmation around the trendline resistance zone, especially if gold fails to break and hold above 4,187–4,198.
Technical View
Gold has recovered strongly from the 3,960 support area, but the current move is still approaching a major decision zone. Price is now testing the descending trendline that has been controlling the broader bearish structure.
The zone around 4,187–4,198 is important because it is marked as a sell order area and sits close to the trendline resistance. If price reacts bearishly here, this area may become the next lower high before another downside move.
Ichimoku also shows that gold is not fully bullish yet. Price is around the Ichimoku value area, where the market often slows down before choosing direction. A clean bullish confirmation needs price to break above this area and hold above the trendline. Without that confirmation, the recovery should still be treated as a corrective move.
The 4,260–4,290 Sell FVG is the higher resistance zone. If gold breaks above 4,198 and continues higher, this FVG may become the next area where sellers watch for reaction.
The downside structure remains valid if price rejects from the current trendline zone. The first reaction zone is around 4,059, followed by the strong support area near 3,960–3,980. If this support breaks, the weekly bearish targets are 3,900–3,920 and 3,740–3,760.
Key Zones
Current price: 4,175
Sell order zone: 4,187–4,198
Trendline resistance: around 4,180–4,200
Price reaction zone: 4,059
Strong support: 3,960–3,980
Target 1: 3,900–3,920
Target 2: 3,740–3,760
Sell FVG: 4,260–4,290
Major resistance: 4,382
Invalidation: above 4,290
Trading Plan
Sell Priority: 4,187–4,198
Condition: wait for bearish rejection, failed breakout above the trendline, or price closing back below the Ichimoku value area.
SL: above 4,290
TP1: 4,059
TP2: 3,960–3,980
TP3: 3,900–3,920
Final target: 3,740–3,760
Alternative Scenario
If gold breaks above 4,198 and holds, the sell setup should not be rushed. In that case, wait for price to move toward the 4,260–4,290 Sell FVG and watch for a new bearish reaction there.
Buy View
Buy is not the priority while price is still below the major resistance and testing the descending trendline. A bullish view becomes cleaner only if gold breaks above 4,290 and holds above the Sell FVG.
Final View
Overall, gold has recovered strongly, but the weekly bullish confirmation is still not clear. The key area for next week is 4,187–4,198. If gold rejects from the trendline and Ichimoku value area, the market may rotate lower toward 4,059, 3,960, and the deeper Fibonacci target zones.
Will gold confirm a breakout above the trendline, or reject from the Ichimoku value area and start a new bearish leg?
Short 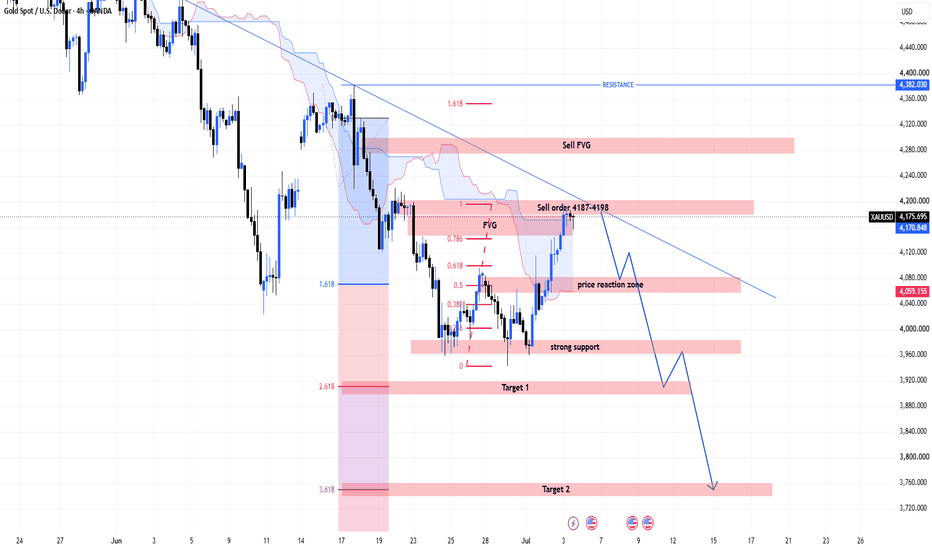
XAUUSD Weekly Recovery Pullback, Main Trend Still Under Pressure
Gold is trading around $4,175 after reacting from the lower support area near the monthly low. The short-term price action is showing signs of a corrective recovery, but the broader structure is still under pressure as price remains below the descending trendline and below the main OB sell zone.
From an SMC perspective, gold has already broken the previous bullish structure and formed a clear CHoCH to the downside. The recent rebound can be viewed as a pullback after a strong bearish leg, not a confirmed bullish reversal yet. As long as price stays below the $4,530–$4,550 OB sell zone, sellers may continue to defend the higher liquidity areas.
For next week, the main scenario is that gold may recover first toward $4,269, then possibly $4,386 if buyers maintain short-term momentum. However, these upper zones are also where liquidity and sell pressure may appear again. The key area to watch is the OB sell zone around $4,530–$4,550, which aligns with the descending trendline and remains the strongest reaction zone on the chart.
Buy setup
Condition:
Gold holds above the monthly low area and forms bullish continuation on lower timeframe. A short-term buy is only valid as a recovery trade, not a full trend reversal.
Entry: $4,100–$4,120 after bullish confirmation
SL: below $3,943
TP1: $4,269
TP2: $4,386
TP3: $4,530–$4,550
Sell setup 1
Condition:
Gold recovers into the $4,269–$4,386 liquidity area and shows bearish rejection with lower timeframe MSS / CHOCH.
Entry: $4,269–$4,386 after rejection
SL: above $4,420
TP1: $4,102
TP2: $3,943
TP3: $3,889
Sell setup 2
Condition:
If gold continues higher into the OB sell zone around $4,530–$4,550 and rejects from the descending trendline, the main bearish continuation setup becomes stronger.
Entry: $4,530–$4,550 after bearish rejection
SL: above $4,620
TP1: $4,386
TP2: $4,102
TP3: $3,889
TP4: $3,720–$3,760
Key levels
Current price area: $4,175
Short-term resistance: $4,269
Buy-side liquidity: $4,386
Main OB sell zone: $4,530–$4,550
Higher buy-side liquidity: $4,777
Strong liquidity: $4,895
Monthly low area: $3,943
Strong lower liquidity: $3,889
Major demand zone: $3,720–$3,760
Bearish continuation confirmation: rejection below $4,530–$4,550
Bullish recovery confirmation: clean break above $4,386
Bearish invalidation: clean daily close above $4,550
My current view is that gold may have a recovery pullback next week, but the main trend is not fully bullish yet. The Prime Gold plan is to avoid selling too low and wait for price to recover into liquidity or the OB sell zone before looking for bearish confirmation. If the market holds above the monthly low, a short-term recovery toward $4,269–$4,386 is possible before the next major decision zone.
No confirmation, no trade.
Long 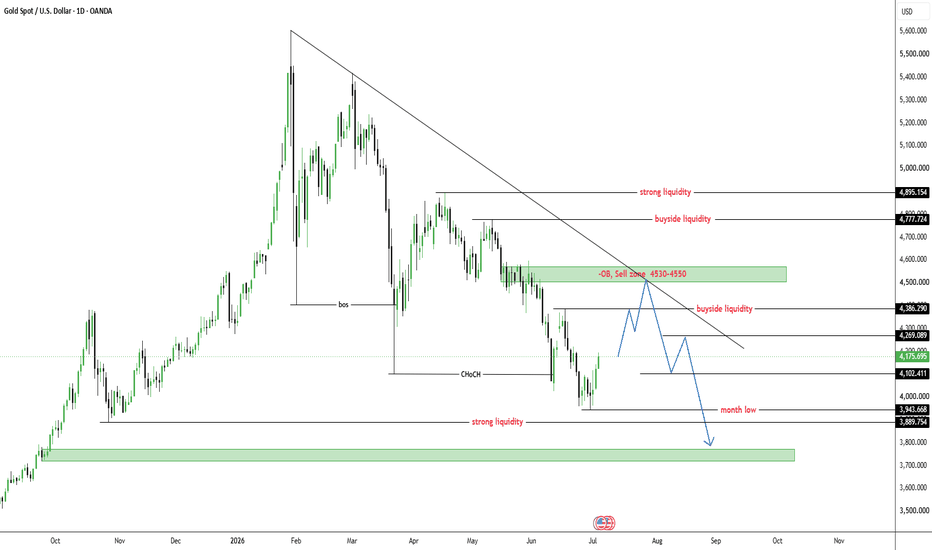
How Will Gold Perform at the End of the Week?Market Outlook
Trend
* The short-term trend remains bullish, with price holding above the ascending trendline and continuing to form Higher Highs and Higher Lows.
* Bullish momentum remains intact; however, price is approaching a major supply zone, so confirmation of a breakout is needed before expecting further upside.
Resistance Levels
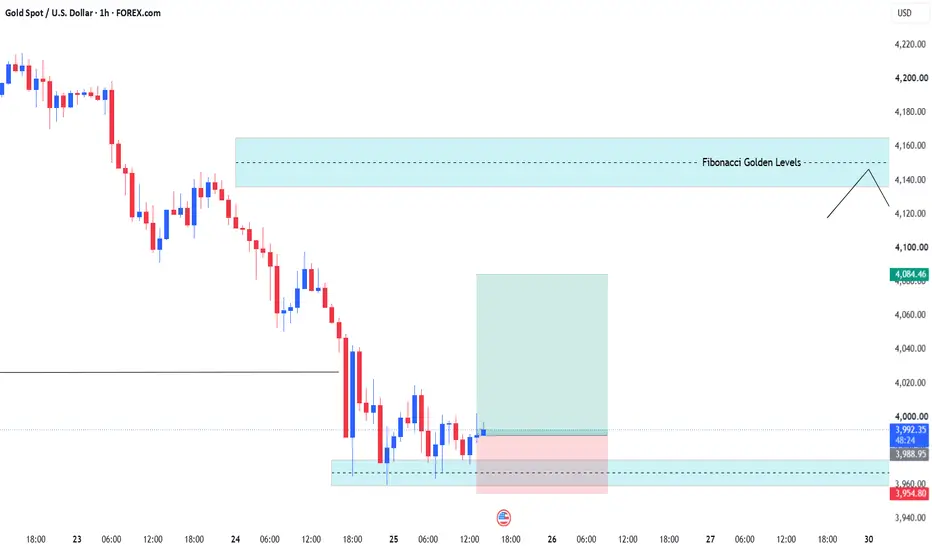
🔵 4,215 – 4,217 – Near-term resistance, a key supply zone, and the primary breakout level.
🔵 4,260 – 4,262 – Major resistance and the next upside target, aligned with the 2.618 Fibonacci extension.
* An H1 candle close above 4,215 would confirm the breakout and open the way for a move toward 4,260.
* If price is rejected from this zone, a short-term pullback may occur before the uptrend resumes.
Support Levels
🟢 4,142 – 4,144 – Immediate support and the breakout zone that should hold to maintain the bullish structure.
🟢 4,095 – 4,097 – Major support, aligned with the ascending trendline and a key demand zone.
* As long as price remains above 4,142, buyers remain in control of the trend.
* A break below 4,142 could trigger a pullback toward 4,095 before the market determines its next directional move.
⸻
Trading Plan
🟢 BUY GOLD
* Entry: 4,040 – 4,042
* Stop Loss: 4,030
* Take Profit: 200 / 500 / 1000 pips
🔴 SELL GOLD
* Entry: 4,215 – 4,217
* Stop Loss: 4,227
* Take Profit: 200 / 500 / 1000 pips
Risk Management
* Risk no more than 1–2% of your account equity per trade.
* Wait for confirmation signals before entering a position.
* Consider moving your stop loss to breakeven once the trade reaches a reasonable profit level to protect your capital and reduce risk. Long 
XAUUSD — Bullish Structure Holds Above EMA Value Zone
Fundamental Analysis
Gold is holding a stronger recovery structure as traders continue to watch USD momentum, Treasury yields, and upcoming U.S. macro data.
For now, the technical structure is improving. As long as price holds above the EMA value zone, the bullish continuation scenario remains favoured.
Technical Analysis
On the 1H chart, XAUUSD is trading around 4,179 after a strong recovery from the lower structure near 3,970 - 4,020. EMA 34, EMA 89, and EMA 200 are starting to turn upward, showing that buyers are gaining better control of the short-term trend.
Price has already broken above the previous EMA resistance area and is now holding above the rising EMA structure. This suggests that the recent pullback may be a continuation setup rather than a bearish reversal.
The first buy zone is around 4,132 - 4,145. This area aligns with the nearest value zone and may act as the first support if price pulls back.
The second buy zone is around 4,088 - 4,113. This is a deeper value area and also aligns with the previous breakout structure. If gold sweeps lower before reacting, this zone may offer a stronger buy reaction.
The main upside target is the Fibonacci range around 4,281 - 4,283.
Important Key Levels
Current price area: 4,179
Buy zone 1: 4,132 - 4,145
Buy zone 2: 4,088 - 4,113
EMA support area: 4,079 - 4,145
Short-term resistance: 4,200 - 4,220
Main Fibonacci target: 4,281 - 4,283
Invalidation area: below 4,079
Trading Scenario
Main Buy Scenario
Entry: 4,132 - 4,145
Stop Loss: 4,120
Take Profit 1: 4,200
Take Profit 2: 4,240
Take Profit 3: 4,281 - 4,283
Buy Condition
The preferred setup is to wait for gold to pull back into the 4,132 - 4,145 buy zone. This area is important because it aligns with the rising EMA structure and the nearest value support.
A buy setup becomes more valid if price forms bullish rejection from this zone, such as a long lower wick, bullish engulfing candle, higher low formation, or a clean reclaim above 4,145.
If price holds above this zone and breaks above 4,200, the bullish continuation view becomes stronger. The next upside focus would be 4,240, followed by the Fibonacci range around 4,281 - 4,283.
Alternative Buy Scenario
Entry: 4,088 - 4,113
Stop Loss: 4,079
Take Profit 1: 4,145
Take Profit 2: 4,200
Take Profit 3: 4,281 - 4,283
Buy Condition
This deeper buy setup is valid only if gold pulls back below the first zone but still holds above 4,079. A rejection from 4,088 - 4,113 would show that buyers are still defending the larger bullish structure.
If price breaks below 4,079 and holds there, the bullish setup becomes weaker and should be reassessed.
Entry Conditions
Wait for price to retest one of the buy zones.
Look for bullish rejection before entering buy.
Do not chase price after a strong move.
A break above 4,200 confirms stronger bullish momentum.
If price breaks and holds below 4,079, the buy setup is invalid.
Overall, the main view remains bullish while XAUUSD holds above the rising EMA structure. The preferred plan is to wait for a pullback into 4,132 - 4,145 or 4,088 - 4,113, then look for buy confirmation toward 4,200, 4,240, and the Fibonacci target around 4,281 - 4,283.
Do you share the same bullish view on gold, or are you waiting for a cleaner pullback into the EMA value zone first?
Long 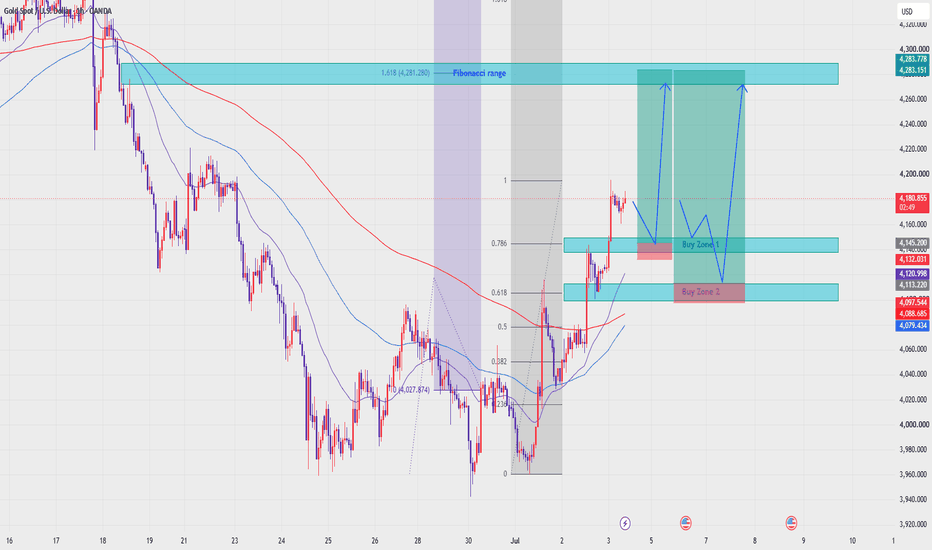
Long 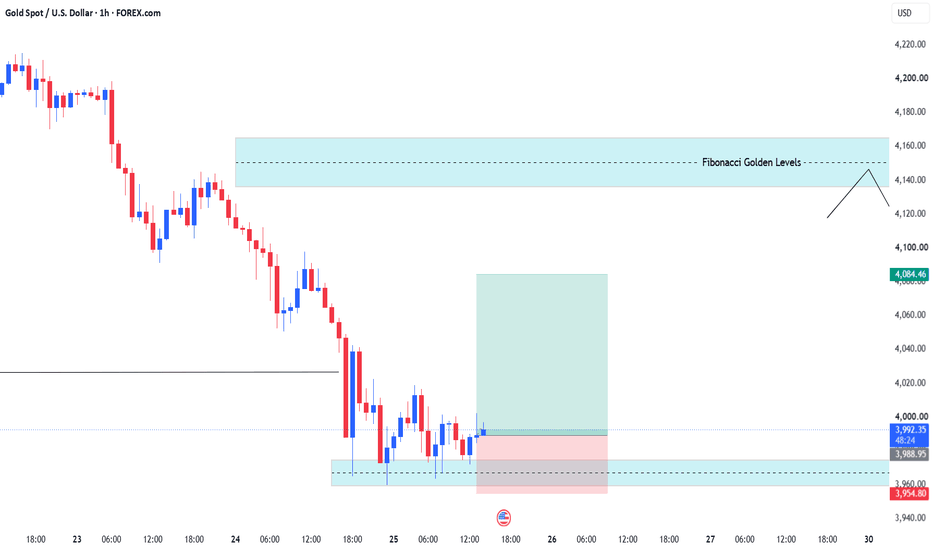
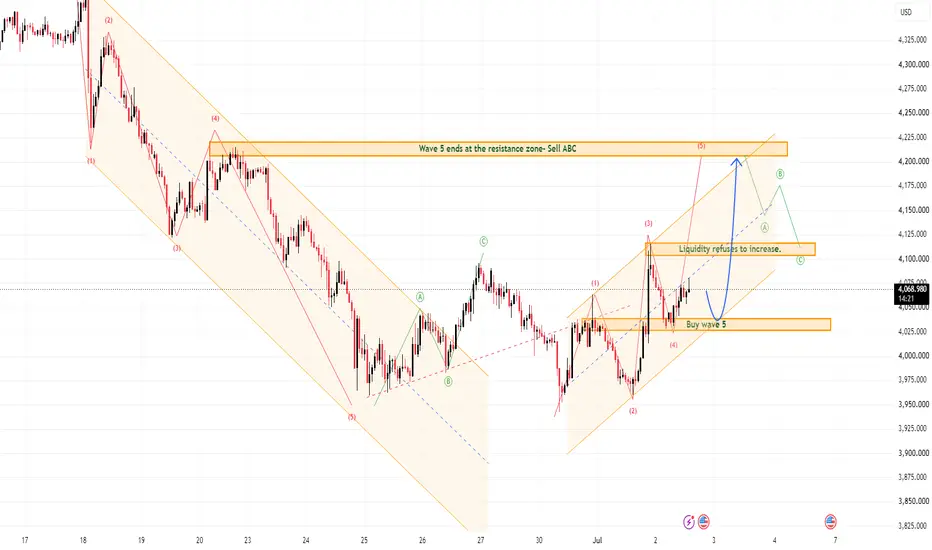
GOLD Bullish Elliott Wave Is Building Inside the Rising Channel
Gold is now showing a stronger recovery structure after breaking away from the previous bearish channel. From Kelly’s view, the market is developing a bullish Elliott Wave sequence, with price moving inside a rising channel and preparing for a possible continuation phase.
The key idea is simple: gold is bullish in the short term, but price may still pull back once more to test the rising trendline before the next upside wave expands.
⟡ Market structure
The chart shows a clear shift from the earlier downtrend into a rising channel. After forming the lower base near the end of June, gold created higher highs and higher lows, showing that buyers are gradually taking control.
Price is now trading around 4,067, after reacting from the buy wave 5 area. The structure remains constructive while gold holds above the lower channel support.
The current move may still need one more retest towards the rising trendline or the buy wave 5 zone before the next push higher. If buyers defend this area, the market may continue towards the liquidity resistance zone around 4,100–4,120.
➤ Key levels
◌ 4,025–4,040: buy wave 5 and trendline reaction zone
◌ 4,067: current price reaction area
◌ 4,100–4,120: liquidity resistance zone
◌ 4,175–4,210: higher resistance and wave 5 completion area
◌ Below 4,025: area where the bullish channel structure weakens
⌁ Elliott Wave view
From an Elliott Wave perspective, gold appears to be forming a bullish 5-wave structure after completing the previous bearish phase.
Wave 1 created the first upside push.
Wave 2 corrected back into the lower channel support.
Wave 3 expanded strongly into the liquidity zone.
Wave 4 is now developing as a short pullback.
If the trendline holds, wave 5 may begin from the buy zone and push price towards the upper channel area.
There is also a possible ABC path after wave 5 completes near resistance. For now, the bullish wave structure remains valid as long as price continues to respect the rising channel.
▸ Trading scenario
Preferred scenario: wait for price to retest the rising trendline or the 4,025–4,040 buy zone and show bullish confirmation.
Entry zone: 4,025–4,040 if bullish confirmation appears
Stop loss: below the confirmed trendline reaction low
Take profit 1: 4,100–4,120
Take profit 2: 4,175
Take profit 3: 4,210 if wave 5 expands strongly
Alternative scenario: if gold breaks below 4,025 and fails to reclaim the rising channel, the bullish Elliott setup weakens and the chart may need a new short-term reading.
⌁ Kelly’s view
For Kelly, this is a buy-the-pullback structure inside a rising channel. The market has already shifted away from the old bearish rhythm, but the cleaner setup may come after one more controlled retest of the trendline.
Gold is building a bullish Elliott structure.
If the rising channel holds, the next upside wave may continue towards the upper liquidity zone.
Share your view below.
Long 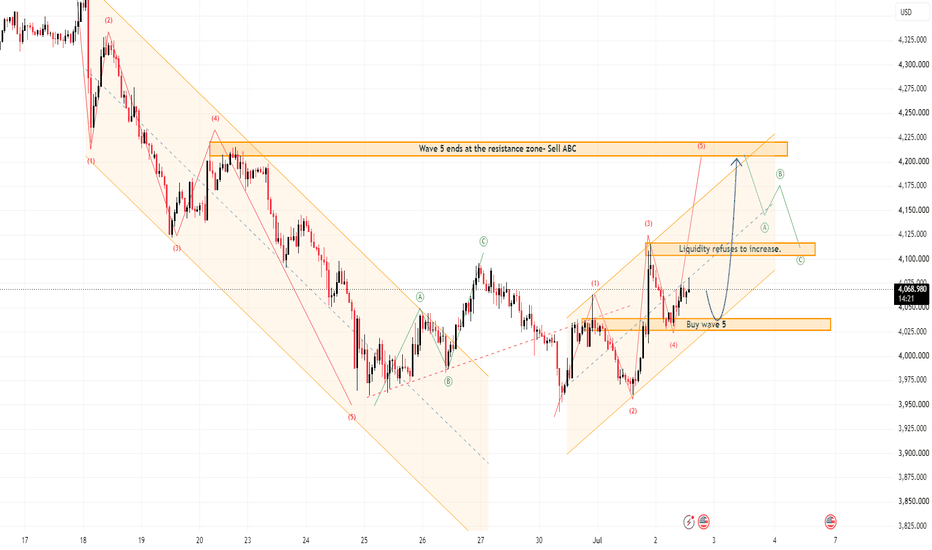
XAUUSD — Bullish Trend Holds, Buy From Major Liquidity Zone
Gold is trading around $4,165 after a strong recovery from the lower structure. The bullish trend is still holding, and price continues to form higher reactions after several CHoCH signals. Buyers are still controlling the short-term structure as long as gold stays above the main liquidity and FVG support area.
From an SMC perspective, gold has already swept the lower sell-side liquidity, reacted from demand, and pushed back into the upper OB zone. The current pullback is not yet a bearish reversal. It can still be viewed as a correction inside a bullish recovery structure, especially if price respects the $4,123–$4,130 liquidity zone.
The main buy area to watch is $4,123–$4,130. This is the closest major liquidity zone where buyers may look to defend the structure. If gold pulls back into this area and confirms bullish MSS / CHOCH on lower timeframe, the next upside target remains the OB reaction zone around $4,180–$4,195, followed by buy-side liquidity near $4,221.
Buy setup 1
Condition:
Gold pulls back into the major buy liquidity zone around $4,123–$4,130 and forms bullish rejection with lower timeframe MSS / CHOCH.
Entry: $4,123–$4,130
SL: below $4,057
TP1: $4,165
TP2: $4,180–$4,195
TP3: $4,221
Buy setup 2
Condition:
If gold breaks above the OB reaction zone around $4,180–$4,195 and retests it as support, bullish continuation remains valid.
Entry: above $4,195 after breakout retest
SL: below $4,150
TP1: $4,221
TP2: $4,240
TP3: $4,260
Sell setup
Condition:
Selling is not the priority. A sell setup is only valid if gold rejects strongly from the $4,180–$4,195 OB zone and loses the $4,123–$4,130 liquidity zone.
Entry: below $4,123 after breakdown retest
SL: above $4,165
TP1: $4,057
TP2: $4,030
TP3: $4,000
Key levels
Current price area: $4,165
Major buy liquidity zone: $4,123–$4,130
FVG support area: $4,070–$4,110
Sell-side liquidity: $4,057
OB reaction zone: $4,180–$4,195
Buy-side liquidity: $4,221
Bullish continuation confirmation: clean break above $4,195
Bullish invalidation: clean 2H close below $4,057
My current view is that gold remains in a bullish recovery structure. The trend is still holding as long as price respects the major liquidity zone around $4,123–$4,130. The Prime Gold plan is to avoid chasing the upper range and wait for price to pull back into liquidity, confirm bullish reaction, then follow the move toward the upper OB and buy-side liquidity.
No confirmation, no trade.
Long 
GOLD - A shift in the fundamental backdrop. Locally bullishFX:XAUUSD is breaking its recent market structure and transitioning into a local distribution phase within the broader bearish trend. The primary focus is on the 4120–4200 range
Gold has staged a strong rebound after weaker-than-expected U.S. employment data shifted Fed rate expectations from hawkish to neutral. The probability of a rate hike at the next meeting has fallen to 18%, while the U.S. dollar and Treasury yields have both declined, creating favorable conditions for a recovery following gold's sharpest quarterly decline in 13 years.
With the July 4th holiday approaching, profit-taking could increase volatility. Although bearish pressure has eased, the broader technical outlook remains cautious.
Technically, after the short squeeze into the 4190–4200 liquidity zone, gold may enter a corrective phase toward support before attempting another move higher. However, both the global and local trends remain bearish
Resistance levels: 4198, 4220, 4329
Support levels: 4150, 4125, 4061
A correction and retest of the 4130–4120 liquidity zone could provide bulls with another opportunity to push the market higher. Market makers may target a retest of 4220, with a potential medium-term extension toward 4330
Best regards,
R. Linda Long 
MASON XAUUSD – Gold Extends Bullish Momentum After NFP
XAUUSD is trading around 4,178 after a strong bullish continuation following the NFP reaction. Price has broken above the previous resistance zone and continues to hold above the Ichimoku structure, keeping the short-term bias bullish.
The priority view remains buy on pullback, but traders should be careful today because bank holiday conditions may reduce liquidity and create irregular price movement.
Technical View
Gold is showing clear bullish momentum after breaking above the previous resistance area around 4,090–4,100. This zone was resistance before, but after the breakout, it can now act as an important support area if price pulls back.
The market is also moving inside a rising trendline channel. This shows that buyers are still controlling the short-term structure, with price creating higher highs and higher lows.
Ichimoku also supports the bullish view. Price is trading above the Ichimoku structure, and the cloud below price may now act as dynamic support. As long as gold stays above the Ichimoku support zone, the bullish recovery remains valid.
The 4,136–4,140 area is the key buy order test zone on the chart. If price pulls back into this area and holds, it may confirm another higher low before continuation.
The next major upside target is around 4,270–4,280. This area matches the Fibonacci 2.618 extension and also sits near a psychological resistance zone, so buyers may take profit or price may react strongly there.
Because today is a bank holiday, liquidity can be thinner than usual. This means price may move fast, but confirmation is still important. Chasing after a strong candle is risky; waiting for a pullback gives a cleaner structure.
Key Zones
Current price: 4,178
Buy order test zone: 4,136–4,140
Previous resistance turned support: 4,090–4,100
Ichimoku support area: 4,028–4,048
Main upside target: 4,270–4,280
Fibonacci extension: 2.618
Invalidation: below 4,090
Trading Plan
Buy Priority: 4,136–4,140
Condition: wait for bullish rejection, higher low formation, or price holding above the rising trendline and Ichimoku structure.
SL: below 4,090
TP1: 4,200
TP2: 4,240
TP3: 4,270–4,280
Alternative Scenario
If gold breaks above 4,200 directly, wait for a retest of this level as support before looking for continuation toward 4,240 and 4,270.
Sell View
Sell is not the priority while price stays above the rising trendline and Ichimoku structure. A sell setup only becomes safer if gold loses 4,136 and breaks back below 4,090 with strong bearish confirmation.
Final View
Overall, gold remains strongly bullish after the NFP reaction. The cleaner plan is to wait for a pullback into the 4,136–4,140 buy zone instead of chasing high prices. If this zone holds, the next upside target remains 4,270–4,280.
Will gold retest the buy zone first, or continue directly toward the Fibonacci psychological resistance?
Long 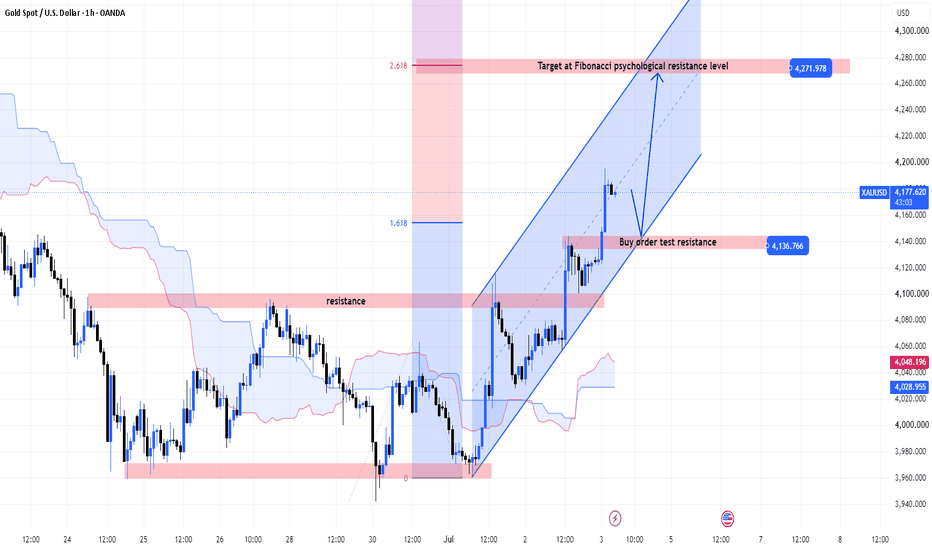
MASON XAUUSD – Trendline Break Confirms Bullish Recovery
XAUUSD is trading around 4,070 after breaking above the descending trendline and recovering above the Ichimoku structure. This breakout changes the short-term structure from bearish pressure into a bullish recovery phase.
The priority view is buy on pullback, as long as gold continues to hold above the broken trendline and the nearest support zone.
Technical View
Gold has broken above the descending trendline that previously capped the upside move. This is an important shift because the market is no longer respecting the same bearish pressure line.
Price is also trading above the Ichimoku support area. The Ichimoku lines are now below price, which means they may act as dynamic support if gold pulls back. As long as price stays above this structure, buyers still have better control in the short term.
The current buy zone around 4,060–4,075 is important because price is testing this area after the breakout. If gold holds here and forms a higher low, the bullish continuation scenario remains valid.
The first upside liquidity area is around 4,114. A clean break above this level may open the way toward Target 1 near 4,155–4,165, which aligns with the Fibonacci 1.618 extension.
If buying pressure continues, the next major liquidity area is around 4,200–4,215, followed by Target 2 near 4,275–4,280, close to the Fibonacci 2.618 extension.
Key Zones
Current price: 4,070
Buy zone: 4,060–4,075
Nearest support: 4,028
Ichimoku support area: 4,016–4,028
Short-term liquidity: 4,114
Target 1: 4,155–4,165
Higher liquidity: 4,200–4,215
Target 2: 4,275–4,280
Invalidation: below 4,009
Trading Plan
Buy Priority: 4,060–4,075
Condition: wait for bullish rejection, higher low formation, or price holding above the broken trendline and Ichimoku support.
SL: below 4,009
TP1: 4,114
TP2: 4,155–4,165
TP3: 4,200–4,215
Final target: 4,275–4,280
Alternative Scenario
If gold breaks above 4,114 directly, wait for a retest of this level as support before looking for continuation toward Target 1.
Sell View
Sell is not the priority while price stays above the broken trendline and Ichimoku support. A sell setup only becomes safer if gold loses 4,028 and breaks back below the Ichimoku structure.
Final View
Overall, gold has confirmed a short-term bullish recovery after breaking the trendline. The cleaner plan is to wait for price to hold the buy zone, then follow the upside structure toward 4,114, 4,155, and potentially 4,275.
Will gold hold the buy zone and continue toward Target 1, or retest the Ichimoku support first?
Long 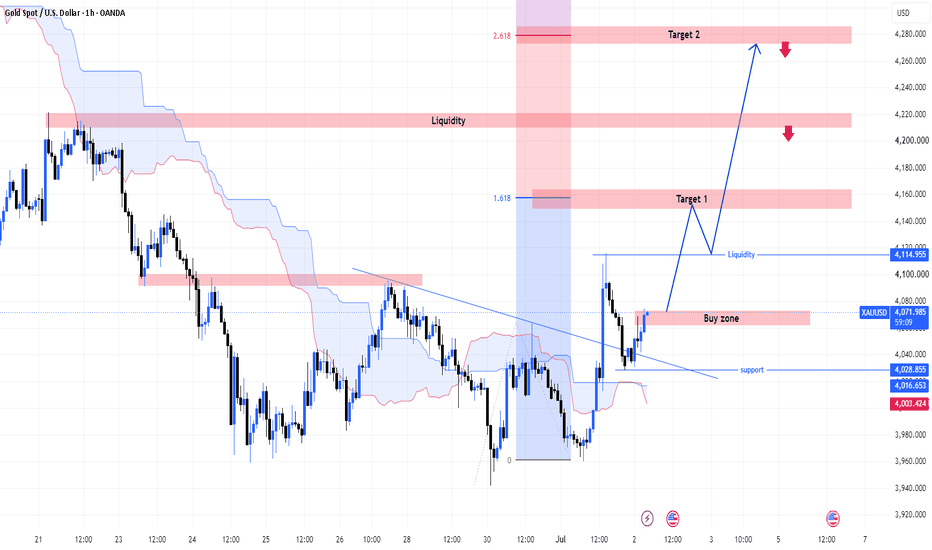
Gold Compres Below Resistance Ahead of High-Impact US EmploymentGold is trading inside a symmetrical triangle as markets await tonight's key U.S. labor market releases, including Initial Jobless Claims, Employment Data, and the final positioning ahead of Friday's Non-Farm Payrolls (NFP). These events are expected to inject significant volatility into both the U.S. Dollar and Gold.
Price remains trapped between a rising trendline and a descending resistance trendline, reflecting a classic ICT liquidity compression before a major macro catalyst. The 4,068–4,072 supply zone is the immediate breakout barrier, while 4,030 and 4,000 represent key demand areas where institutional buyers may re-enter if downside liquidity is swept.
📊 Key Levels
Market Structure: Symmetrical Triangle (Compression Phase)
🟥 Primary Resistance: 4,068–4,072 (Supply / Breakout Zone)
🟩 Intraday Demand: 4,030 (Bullish Mitigation Area)
🟦 Major Institutional Support: 4,000 (Liquidity Pool)
📈 Market Sentiment
Gold is consolidating as institutions reduce exposure ahead of major U.S. employment data. A breakout above 4,072 could trigger a buy-side liquidity sweep toward 4,090–4,100, while rejection from resistance may drive price back toward 4,030 and potentially the 4,000 institutional demand zone.
💬 Will tonight's U.S. employment data trigger a bullish breakout above resistance, or will sellers defend the triangle and extend the bearish trend ahead of NFP? Share your outlook below! 👇 Long 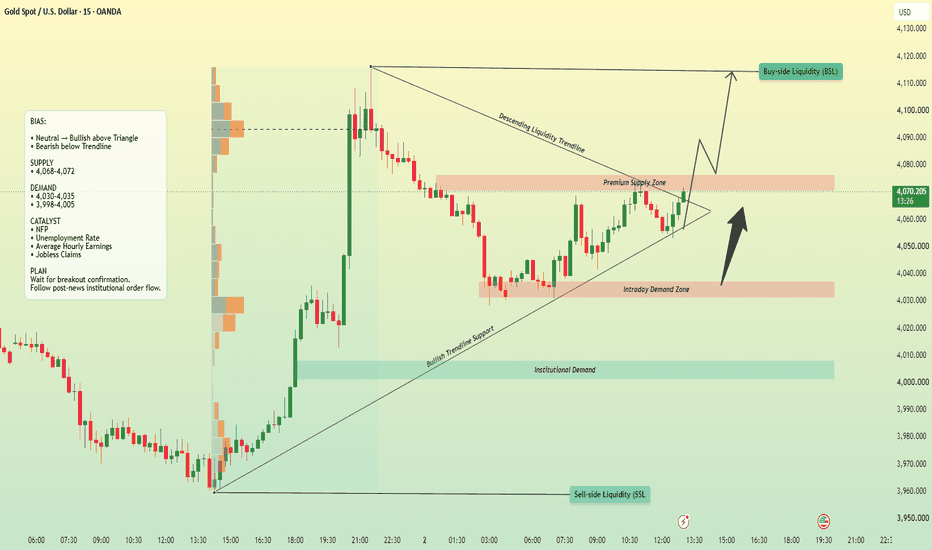
All Eyes Are on Today’s Nonfarm Payrolls (NFP) Report.Market Outlook
Trend
* The short-term trend has turned bullish after price broke above the descending trendline and successfully held above the key support zone.
* Bullish momentum remains intact, but price must break through the resistance levels to confirm a continuation of the uptrend.
Resistance Levels
🔴 4,093 – 4,095 – Near-term resistance and a key breakout level.
🔴 4,154 – 4,156 – Major resistance, aligned with a key supply zone and the 1.618 Fibonacci extension.
* An H1 candle close above 4,093 would confirm the breakout and open the way for a move toward 4,156.
* If price is rejected at 4,093, it may pull back to retest the support zone before attempting another move higher.
Support Levels
🟢 4,035 – 4,037 – Immediate support and the breakout zone that should hold to maintain the bullish outlook.
🟢 4,010 – 4,012 – A potential buying support zone, aligned with the ascending trendline.
🟢 3,965 – Major support, marking the low of the recent recovery and converging with the ascending trendline.
* Holding above 4,010 – 4,012 will keep buyers in control.
* A break below this zone would weaken the bullish momentum and could lead to a retest of 3,965.
⸻
Trading Plan
🟢 BUY GOLD
* Entry: 4,012 – 4,010
* Stop Loss: 4,000
* Take Profit: 200 / 500 / 1000 pips
🔴 SELL GOLD
* Entry: 4,154 – 4,156
* Stop Loss: 4,166
* Take Profit: 200 / 500 / 1000 pips
Risk Management
* Risk no more than 1–2% of your account equity per trade.
* Wait for confirmation before entering a position.
* Consider moving your stop loss to breakeven once the trade reaches a reasonable profit level to protect your capital and reduce risk. Long 
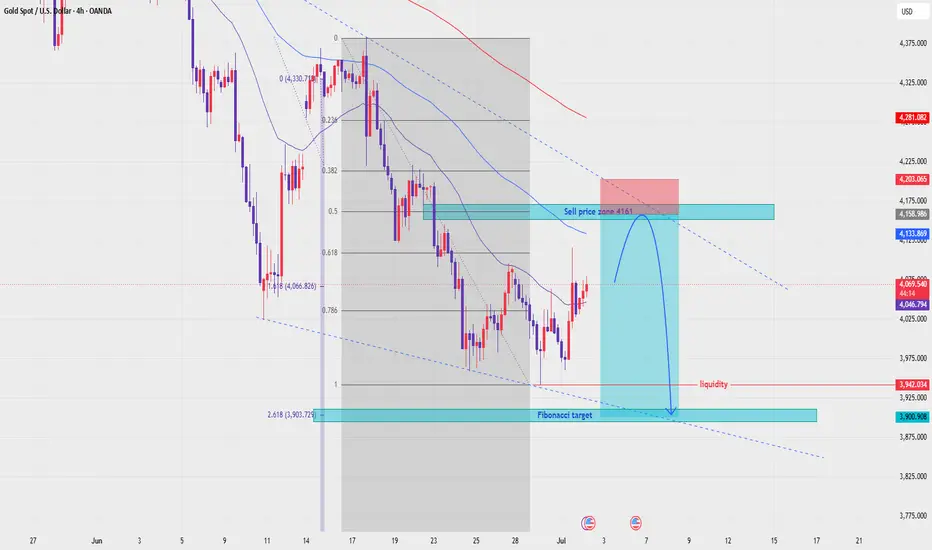
XAUUSD — Sell From Fibonacci Value Zone With EMA Trend
Fundamental Analysis
Gold remains under pressure as traders continue to watch USD strength, Treasury yields, and upcoming U.S. macro data.
For now, the technical structure still favours sellers while price trades below the main EMA resistance area. Any recovery should be treated as a pullback unless gold can reclaim the EMA value zone with strong confirmation.
Technical Analysis
On the 4H chart, XAUUSD is still moving inside a bearish structure. EMA 34, EMA 89, and EMA 200 remain above price, showing that the main trend is still controlled by sellers.
Price is currently around 4,072 after reacting from the lower area. The recovery is approaching the Fibonacci value zone and EMA resistance area, where sellers may look for continuation entries.
The key sell zone is around 4,158 - 4,203. This area aligns with the Fibonacci retracement zone, EMA resistance, previous support turned resistance, and the descending trendline pressure.
If price reaches this zone and shows bearish rejection, the next downside focus is the liquidity zone around 3,942, followed by the Fibonacci target near 3,900.
Important Key Levels
Current price area: 4,072
Main sell value zone: 4,158 - 4,203
EMA resistance area: 4,133 - 4,281
Short-term reaction level: 4,046
Liquidity target: 3,942
Fibonacci target zone: 3,903 - 3,900
Invalidation area: above 4,203 - 4,220
Trading Scenario
Main Sell Scenario
Entry: 4,158 - 4,203
Stop Loss: 4,220
Take Profit 1: 4,046
Take Profit 2: 3,942
Take Profit 3: 3,903 - 3,900
Sell Condition
The preferred setup is to wait for gold to recover into the 4,158 - 4,203 Fibonacci value zone. This area is important because it aligns with EMA resistance and the previous bearish structure.
A sell setup becomes more valid if price forms bearish rejection from this zone, such as a long upper wick, bearish engulfing candle, failed breakout, or lower high below the EMA structure.
If price rejects from the sell zone and breaks back below 4,046, the bearish continuation view becomes stronger. The next downside target would be 3,942, followed by the Fibonacci target zone around 3,903 - 3,900.
Entry Conditions
Wait for price to retest 4,158 - 4,203.
Look for bearish rejection before entering sell.
Do not sell aggressively at the low without a pullback.
A break below 4,046 confirms stronger downside pressure.
If price breaks and holds above 4,220, the sell setup is invalid.
Overall, the main view remains bearish while XAUUSD trades below EMA 34, EMA 89, and EMA 200. The preferred plan is to wait for a pullback into the Fibonacci and EMA value zone, then look for sell confirmation toward 4,046, 3,942, and 3,900.
Do you share the same bearish view on gold, or are you waiting for a cleaner rejection from the Fibonacci value zone first?
Short 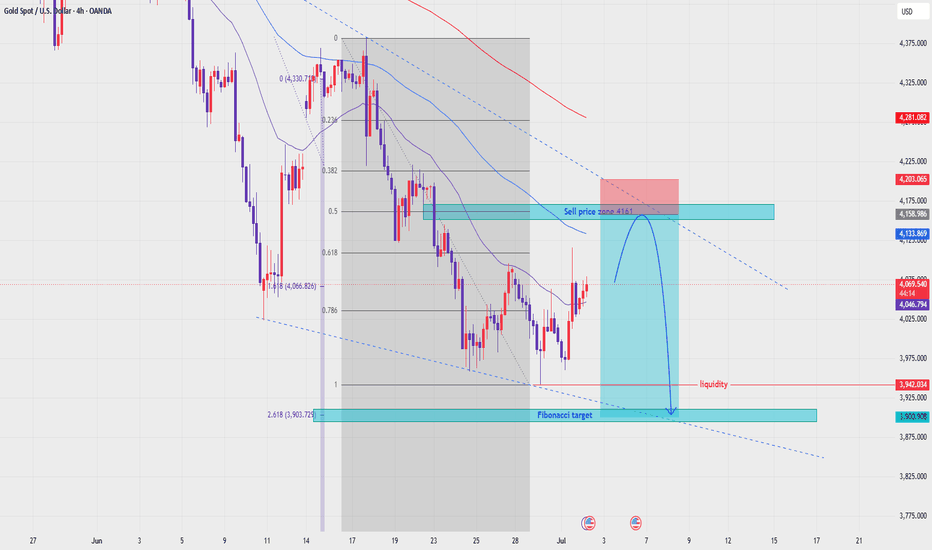
BITCOIN - A false breakout of resistance during a bearish trendBINANCE:BTCUSDT.P remains in a bearish trend and is currently retesting the 60700 resistance zone. Both the global and local trends continue to favor the downside.
Bitcoin is caught between three key forces: the Fed's softer rhetoric (Kevin Warsh signaled easing inflation risks, reducing pressure on risk assets), record institutional outflows (the tenth consecutive day of ETF outflows, with $4.5 billion withdrawn in June), and a countertrend correction within the broader bearish trend.
Technically, the market is showing signs of a false breakout around resistance as sellers attempt to defend the area. Consolidation below 60700 could trigger another leg lower.
Resistance levels: 60700, 62200
Support levels: 59555, 58320, 58030
The focus remains on two key trigger levels: 60730 and 62232. If the market fails to reclaim 60730 after the false breakout, Bitcoin could resume its decline toward 59500–58000. However, a retest of the 62200 resistance zone cannot be ruled out. A short squeeze into either resistance area could create the conditions for another bearish move.
Best regards,
R. Linda  Short
Short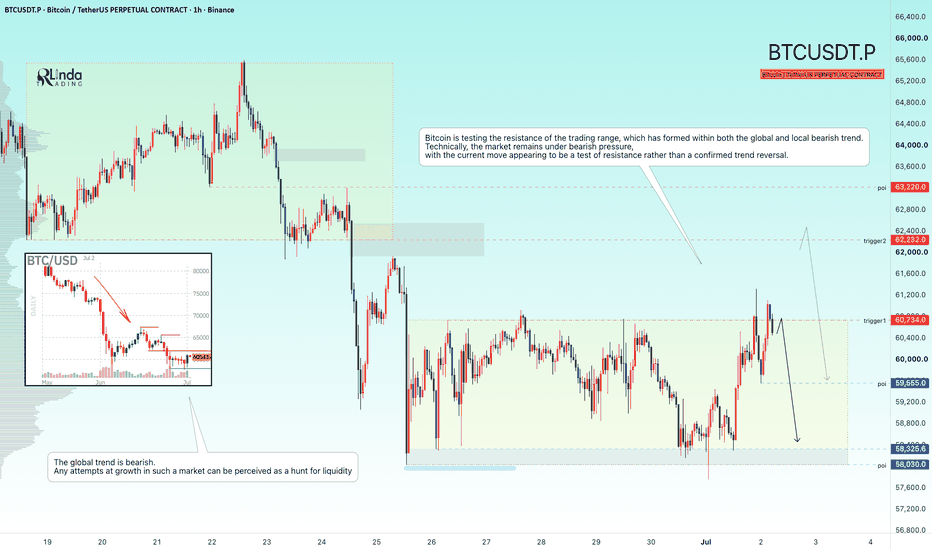
XAUUSD: Elliott Bearish Wave Is Still Developing
Gold is still trading under pressure after failing to hold the recovery structure above the 4,000 area. From Kelly’s view, the current chart is forming a bearish Elliott wave sequence, and price is now moving inside the next downside phase.
The key idea is simple: gold remains weak while price stays below the 3,970–3,980 resistance area, and the lower Elliott wave target is still open.
⟡ Market structure
The chart shows gold moving in a clear lower-high and lower-low structure. After the previous rebound failed near the 4,080 area, price rotated lower and is now trading back around the 3,960 zone.
The current resistance around 3,970–3,980 is important because it sits near the sell wave 5 zone. If buyers cannot reclaim this area, the market may continue following the bearish structure towards the lower support zone.
The downside area around 3,790–3,800 remains the main Elliott wave completion zone on the chart.
➤ Key levels
◌ 3,970–3,980: near-term sell wave 5 resistance
◌ 3,930–3,940: wave 4 reaction area
◌ 3,960: current price reaction zone
◌ 3,790–3,800: Elliott 5-wave cycle target
◌ Above 4,000: area where the bearish structure starts to weaken
⌁ Elliott Wave view
From an Elliott Wave perspective, gold appears to be building a bearish 5-wave structure after the corrective recovery ended.
Wave 1 created the first downside move from resistance.
Wave 2 corrected higher but failed to reclaim the previous structure.
Wave 3 pushed price lower with stronger momentum.
Wave 4 may be forming as a small consolidation near the current area.
If resistance continues to hold, wave 5 may extend lower towards the 3,790–3,800 zone.
This is why Kelly would not treat the current reaction as a full bullish reversal yet. The market is still trading below resistance, and the Elliott structure still favours one more downside leg.
▸ Trading scenario
Preferred scenario: wait for price to reject from the 3,970–3,980 sell zone before expecting wave 5 continuation.
Sell zone: 3,970–3,980 if bearish confirmation appears
Stop loss: above 4,000 or above the confirmed rejection high
Take profit 1: 3,930
Take profit 2: 3,880
Take profit 3: 3,790–3,800
Alternative scenario: if gold breaks above 4,000 and holds with strong acceptance, the bearish wave 5 setup weakens and the chart may need a new short-term reading.
⌁ Kelly’s view
For Kelly, this is still a bearish Elliott structure. The market has not shown enough strength to confirm a reversal, and the current reaction is happening directly below resistance.
As long as gold stays below the sell wave 5 zone, the cleaner structure remains to the downside.
Gold is still forming a bearish wave sequence.
If resistance holds, the final wave may continue towards the lower Elliott target.
Share your view below.
Short 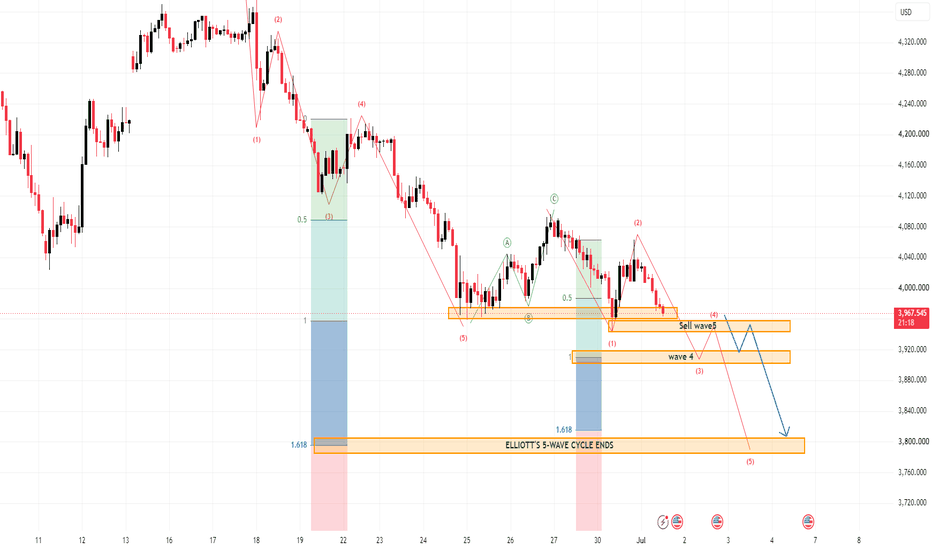
GOLD - Consolidation amid a bearish trend ICMARKETS:XAUUSD remains in both a global and local bearish trend. Within the broader downtrend, the market is consolidating, with price action suggesting a potential continuation lower. The key range to watch is 3959–4018–4090
Gold continues to trade under pressure. The main event in focus is Fed Chair Kevin Warsh's speech at the ECB Forum in Sintra. His comments could either reinforce or challenge the Fed's recent hawkish stance.
The U.S. dollar continues to strengthen amid renewed U.S.–Iran tensions, hawkish Fed rate expectations, and USDJPY climbing to multi-decade highs. Together, these factors continue to weigh on gold.
Key drivers:
Bearish: stronger U.S. dollar, rising Treasury yields, hawkish Fed signals, ongoing geopolitical uncertainty.
Bullish: progress in geopolitical negotiations, weaker U.S. economic data, or a dovish shift from the Fed
Resistance levels: 4018, 4090, 4121
Support levels: 3959, 3886, 3819
Gold remains in a well-defined bearish structure on both the local and higher timeframes. The preferred trading bias remains to the downside, with 3959 and 4018 serving as the key trigger levels. Price is consolidating around 3959, while the reaction from buyers is gradually weakening. A breakdown below support—or a short squeeze into 4018—could trigger the next impulsive move lower
Best regards,
R. Linda Short 
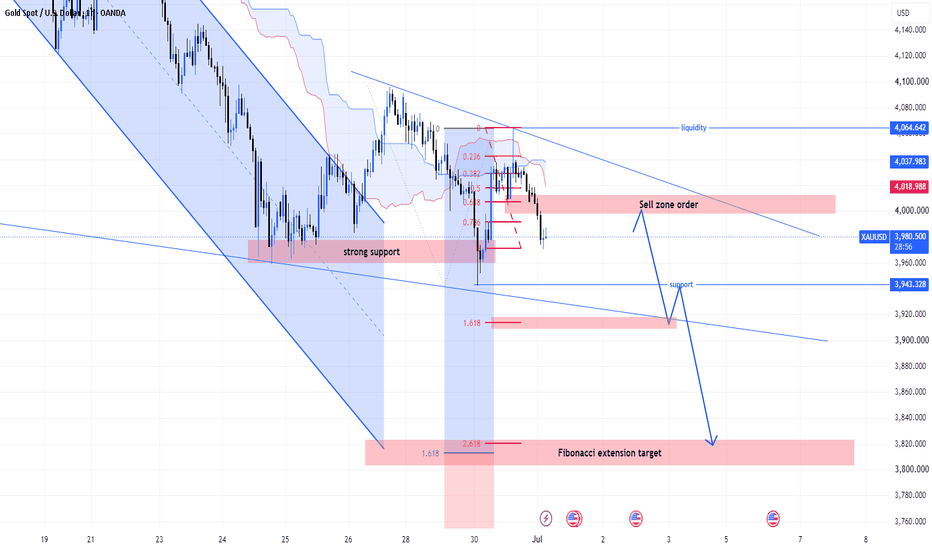
XAUUSD – Bearish Pressure Holds Below Ichimoku And TrendlineMASON XAUUSD – Bearish Pressure Holds Below Ichimoku And Trendline
XAUUSD is trading around 3,980 after failing to recover strongly from the recent support area. Price remains below the Ichimoku structure and under the descending trendline, so the main bias is still bearish.
The priority view is to look for sell confirmation on pullbacks, especially if gold retests the sell order zone.
Technical View
Gold is still moving under bearish pressure. The recent recovery attempt failed to break the descending trendline, showing that buyers have not taken control of the structure yet.
Price is also trading below the Ichimoku resistance area. This supports the bearish view because the cloud and Ichimoku lines are still acting as dynamic resistance above price. As long as gold stays below this structure, every rebound should be treated as a correction.
The trendline is important because it continues to cap the upside. If price pulls back into the 3,998–4,018 sell order zone and rejects, this may confirm another lower high inside the bearish trend.
The 3,943 support is the first downside area to watch. If gold breaks below this level, selling pressure may continue toward the Fibonacci 1.618 area near 3,910.
The deeper bearish target is the Fibonacci extension zone around 3,810–3,825. This area becomes more realistic if gold breaks support cleanly and fails to recover above the sell zone.
Key Zones
Current price: 3,980
Sell order zone: 3,998–4,018
Short-term resistance: 4,018
Upper liquidity area: 4,037–4,064
Nearest support: 3,943
Fibonacci 1.618 target: 3,910
Fibonacci extension target: 3,810–3,825
Invalidation: above 4,064
Trading Plan
Sell Priority: 3,998–4,018
Condition: wait for bearish rejection, failed breakout above 4,018, or lower high formation below the descending trendline.
SL: above 4,064
TP1: 3,943
TP2: 3,910
TP3: 3,810–3,825
Alternative Scenario
If gold breaks below 3,943 directly, wait for a retest of this level as resistance before looking for sell continuation toward 3,910 and the Fibonacci extension target.
Buy View
Buy is not the priority while price stays below the Ichimoku structure and descending trendline. A buy setup only becomes safer if gold breaks above 4,064 and holds above the liquidity area.
Final View
Overall, gold remains in a bearish structure. The cleaner plan is to wait for price to retest the sell order zone, then watch for rejection. As long as 4,018–4,064 holds as resistance, the downside path toward 3,943, 3,910, and 3,810–3,825 remains in focus.
Will gold reject from the sell order zone first, or break support directly toward the Fibonacci extension target?
Short