GBPJPY Breakdown: Is a Deeper Correction Beginning?GBPJPY ( OANDA:GBPJPY ) started to decline after reacting to the upper boundary of the Ascending Channel and the resistance zone(221.35 JPY-219.32 JPY).
After breaking below the support lines, the pair formed a Symmetrical Triangle, and its lower trendline has now been broken.
Can GBPJPY recover, or is the pair entering a deeper corrective phase?
Technical Analysis
From an Elliott Wave perspective, GBPJPY appears to have completed its main Five-Wave Impulsive Structure above the Ascending Ch
Triangle
SOLUSDT - Manipulation by MM could trigger a drop BINANCE:SOLUSDT remains in a broader bearish trend, with price developing a local downtrend inside the 74.55โ72.30 trading range. Within this structure, I expect a potential market maker manipulation phase
The fundamental backdrop for the cryptocurrency market remains weak. Bitcoin has already broken its local bullish structure and is building bearish momentum ahead of a possible continuation lower. Further weakness in the market leader could weigh on the rest of the crypto market
Against
EURUSD: Sellers Defend 1.1400 โ 1.1330 Becomes the Next TargetHello everyone, here is my breakdown of the current EURUSD setup.
Market Analysis
EURUSD previously traded above a rising trendline before breaking below it, confirming a shift in momentum. Price then entered a descending channel, where multiple failed breakouts near the 1.1400 Resistance Zone confirmed that sellers remain in control. The latest rejection from channel resistance reinforces the bearish structure.
Currently, EURUSD is trading below the 1.1400 Resistance Zone while holding abov
GOLD - Ahead of the Fed meeting. Bearish trendICMARKETS:XAUUSD is rebounding from the 4000 level but remains trapped within the 4010โ4050 trading range. At the same time, the U.S. Dollar Index has entered a consolidation phase as markets await the upcoming Federal Reserve meeting
Gold is trading cautiously ahead of the Fed decision amid renewed geopolitical tensions. The key catalyst will be the Fed's guidance on the future path of interest rates. Any hint of a dovish shift could fuel a rally in gold, while a hawkish message would lik
XAUUSD for those who like to swing tradingOANDA:XAUUSD
XAUUSD now trading at premium valuation and got bearish movement from year to date as the impact of premium price.
I still think gold will keep trading at premium valuation and this is my long plan:
BUY ZONE 1:
Entry: 3860-4000
SL: 3830
BUY ZONE 2:
Entry: 3625-3800
SL: 3580
If price breaking below buy zone 2 with strong daily candle, there is possibility we can trade long at attractive valuation of 3100-3350 and hold from there.
Use good risk management.
This is my opinion.
D
EXPE- Symmetrical Triangle Breakout Setup EXPE is attempting to break out of a symmetrical triangle after nearly six months of consolidation.
While the price is pushing above the upper trendline, I prefer to wait for confirmation rather than anticipate the move. For me, a valid breakout requires a decisive close above $279.22, which marks the triangle's second swing high and would confirm buyers have taken control.
Key Levels to Watch:
Breakout Confirmation: $279.22
Target 1: $358.92 (+28% from the breakout level)
Target 2: $4
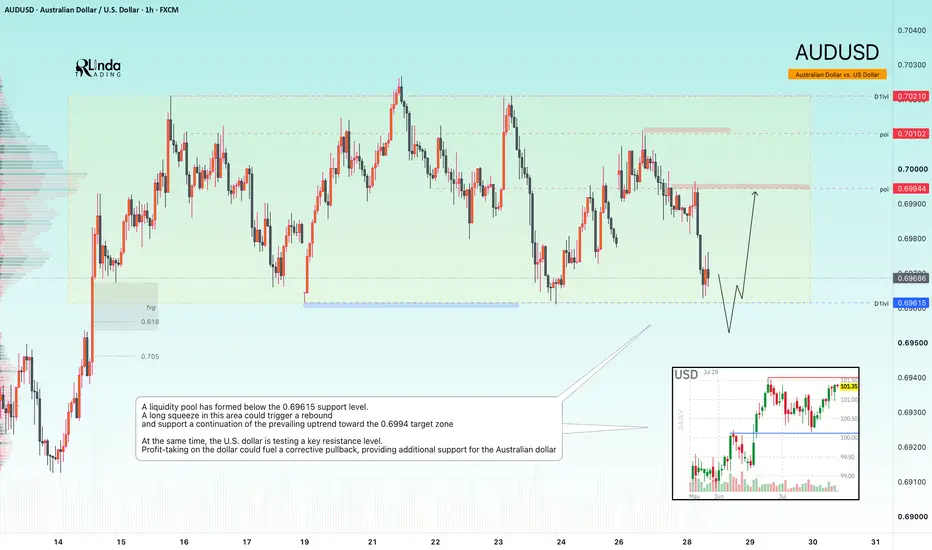
AUDUSD - A long squeeze could trigger a rally FX:AUDUSD is testing a key support zone, with a significant liquidity pool positioned just below it. The broader daily trend remains bullish, giving buyers an opportunity to regain control
At the same time, the U.S. Dollar Index is testing resistance. Profit-taking near the 101.5 area could trigger a pullback in the dollar, providing additional support for the Australian dollar.
From a technical perspective, a substantial liquidity pool has formed below 0.69615. A long squeeze in this area
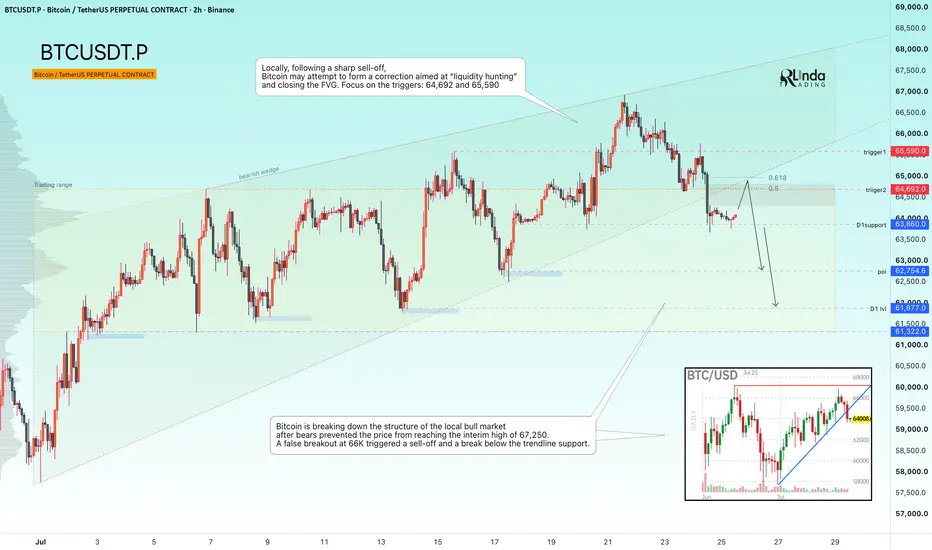
BITCOIN - A countertrend correction before a decline BINANCE:BTCUSDT.P is breaking the local bullish market structure within a broader bearish distribution phase while also forming a false breakdown below the 63,680 support area. The market continues to reinforce the dominance of the higher-timeframe bearish trend, although a corrective rebound remains possible before the next leg lower
Higher timeframe: The broader bearish trend remains intact. Sellers prevented price from reaching the key technical retracement level at 67,250, while a weak
EUR/USD Coiling For Another Leg LowerIt may not have arrived after a prolonged bullish run, but Monday's bearish pin candle from a known resistance level still warns downside risks are evident in the days ahead.
Not only does EUR/USD remain in a well-established longer-term downtrend beneath its key medium and long-term moving averages, but we're also seeing a shorter-term bearish trend emerge from the middle of July, with each bounce ending in failure. That leaves the price coiling in a structure that resembles a descending trian
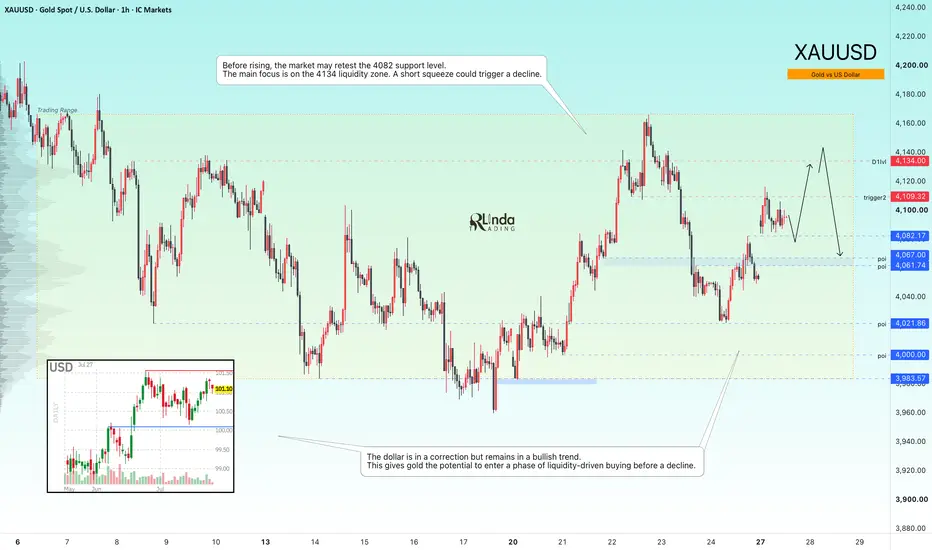
GOLD - Correction Before a Decline ICMARKETS:XAUUSD remains under pressure from the broader bearish trend. However, within this primary direction, the market is developing a sideways range and a countertrend correction. A stronger U.S. dollar could once again weigh on the metal
Gold has received temporary support from the recent geopolitical pause and a softer U.S. dollar. However, the sustainability of the recovery remains uncertain as markets await the upcoming Federal Reserve decision and further developments in the Midd
PKG- This Boring Stock Could Be My Swing Trade of the YearThese are the swing trades every trader hopes to find.
Last Friday, PKG had a massive breakout day, gaining more than 8% and pushing above a textbook symmetrical triangle pattern.
What makes this breakout even more interesting is that it wasn't driven by technicals alone. It was backed by several strong fundamental catalysts all hitting at the same time: an earnings beat, solid shipment data, and optimistic guidance around future pricing realization. That's exactly the kind of news flow you wa
Three tries at 0.9890. Wednesday's CPI decides the fourthAUD/CAD - long swing setup, ARMED (1D)
THE SETUP
AUD/CAD has run into the same ceiling three times this month. The daily highs print at 0.98874, 0.98890 and 0.98882 - 1.6 pips between the highest and the lowest, which is close enough to call it one price. Underneath it the lows keep rising: 0.97613, then 0.98024, then 0.98079, then 0.98463 today. Flat top, rising floor. That is an ascending triangle, and the coil is tight enough that ADX has dropped to 13.2 while all twelve moving averages I tr
๐ญ๐๐ ๐๐ฎ๐ถ๐น๐ ๐ง๐ฟ๐ถ๐ฎ๐ป๐ด๐น๐ฒ๐ญ๐๐ ๐๐ฎ๐ถ๐น๐ ๐ง๐ฟ๐ถ๐ฎ๐ป๐ด๐น๐ฒ ๐ช๐ถ๐๐ต ๐ฆ๐๐ผ๐ฐ๐ต๐ฅ๐ฆ๐ ๐๐๐ ๐ฆ๐ถ๐ด๐ป๐ฎ๐น
CRYPTOCAP:ZEC is currently trading inside a large symmetrical triangle on the daily chart, with price being compressed between descending resistance and rising support.
Historical studies show that roughly ๐ฒ๐ฌ% ๐ผ๐ณ ๐๐๐บ๐บ๐ฒ๐๐ฟ๐ถ๐ฐ๐ฎ๐น ๐๐ฟ๐ถ๐ฎ๐ป๐ด๐น๐ฒ๐ continue in the direction of the previous trend. Upward breakouts can produce an average move of around ๐ฏ๐ฐ%, although not every breakout reaches its full technical target.
The daily StochRSI has now generated another
APLAPOLLO | Risk-Takers Buy @LTP or Safer Entry above @1850 APLAPOLLO | Risk-Takers Buy @LTP or Safer Entry above @1850 | Strict SL below 1800 | 1st Target 2020
*********************************************************************
The stock market involves risk, risk, and only risk. To survive in the market, accepting stop-loss with discipline and without hesitation. There is no other way to protect you capital.
Any stock I share is either already part of my existing holding or I take a fresh entry at the same level I mention. I always place the stop-l
EURUSD: Breaks Below Rising Channel โ 1.1330 Support in FocusHello everyone, here is my breakdown of the current EURUSD setup.
Market Analysis
EURUSD previously traded inside a large symmetrical triangle before breaking below support, confirming a bearish shift in market structure. After the breakdown, price consolidated inside a broad range and later broke lower once again, extending the downtrend.
Currently, EURUSD is trading inside an upward channel while remaining below the 1.1430 Resistance Zone and the long-term descending trendline. The latest
$SPCX two patterns, two directionsNASDAQ:SPCX
Interesting short-term setup here. Fridayโs post-market price was hovering around the $112 mark, keeping the descending triangle in play.
Conversely, a double bottom pattern is currently in the making and would validate on a break of $118.26 to project a rebound target of $125.
Neither setup is valid until price breaks out.
The most likely direction usually aligns with the prevailing trend, so the triangle may prove the more favorable one here.
ETHUSDT: ascending triangle long into the $2K short wallETHUSDT โ Long swing setup (1D)
THE SETUP
ETH has built a clean staircase of higher lows through July (~1,450 to 1,600 to 1,700 to 1,800 to now ~1,870) while capped by the $2,000 round number โ an ascending triangle. Rising demand into fixed resistance is a bullish continuation structure, and $2,000 is stacked with shorts (reports cite ~$975M above $1,952). A reclaim would force covering โ squeeze fuel.
CONFLUENCES
- Daily uptrend intact: higher lows, structure unbroken above $1,800
- Entry at
TRIANGLE BREAKOUT IN DJML- EDUCATIONAL PURPOSEStock has undergone huge correction from 209 ( Dec -2024) to 52 ( Dec 2025) i.e. 75% correction in 1 year. After that stock stated rising and now triangle breakout is seen in May 2026, after retesting the breakout level stock is ready to continue the rally. Higher high higher low structure is also formed which indicates uptrend.
Long position can be initiated at CMP 114.40
TARGET : 198 (73%)
SL : 96 (-16%) ON WEEKLY CLOSING BASIS
RR RATION :1:4.5
TIME HORIZON : 3 YEARS(JULY 2029)
ONLY FOR INVES
GOLD - The Hunt for Liquidity (Correction) Before the Drop ICMARKETS:XAUUSD is recovering after Thursday's sharp decline, trading around $4,060 on Friday. This rebound may represent nothing more than a liquidity-building move before the broader downtrend resumes
The U.S. dollar continues to strengthen, while gold remains under selling pressure, reinforcing the prevailing bearish market structure. The broader trend remains firmly bearish.
From a technical perspective, gold continues to face pressure from geopolitical uncertainty and hawkish Federal
QNT Main Trend. Triangle. Distribution. January 2026Time frame: 1 week. After a 147,000% pump, a large symmetrical triangle forms in the distribution zone (this is possible due to the limited supply of only 14.88 million coins, and the concentration of the bulk of the volume among the creators). Reversal zones and percentages to key support/resistance levels are shown.