EURCAD: Bullish Continuation Confirmed 🇪🇺🇨🇦
EURCAD retested a recently broken daily/intraday horizontal resistance.
The price broke a falling channel to the upside on an hourly time frame then,
confirming the strength of the buyers.
I will expect a bullish continuation on Monday.
Goal will be 1.5917
❤️Please, support my work with like, thank you!❤️
I am part of Trade Nation's Influencer program and receive a monthly fee for using their TradingView charts in my analysis.
Wedge
Rising Wedge 4HR (Bearish)On SOLUSDT I can see a rising wedge pattern that has formed during a down trend, I will keep an eye on this and look for an entry upon confirmation of this pattern breaking down.
In this idea I have mapped out potential supports that I have seen and the rising wedge itself.
Please feel free to have your own input and criticize this idea.
**PLEASE NOT I HAVE BEARISH BIAS AT THE MOMENT, HAPPY TO HEAR A BULLISH CASE FOR THE PAIRING**
Textbook Patterns | How to Spot a WedgeBest way to spot chart patterns are by simply looking for the loss in momentum and linking the external points to outline the pattern your looking for.
I'll stick to just one textbook pattern to keep it simple for now.
LOSS IN MOMENTUM
In this first example starting from the left side of the chart we can see buyers lose momentum by identifying external points and visually looking for exhaustion as price continues to rise.
Same goes with the sellers when price declines. Momentum dies off and hands the power back over to bulls.
PATTERN
Now that we spotted the loss in momentum we can link those external points to create a visual representation of a wedged-like shape.
BREAKOUT
A squeeze is now created at the smallest point of the shape and this is where the breakout occurs.
BONUS
Another way to make sure these patterns are valid and powerful is by looking for areas of liquidity and or levels of support/resistance.
Hope this was educational and helpful as it could strengthen your current strategy or if your a beginner this may have been very insightful, enjoy! :)
XAUUSD/ Bear market trading?
The long positions executed last time have started generating considerable profits again. It's still advisable to buy now; buying below 4640 remains a healthy entry point.
Traders who follow my posts and trade accordingly, please remember to keep an eye on the notifications I send through internal channels. This way you can see my subsequent closing positions and won't miss any new trading opportunities. Because as a trader, the timing of any buy/sell or order closing is crucial. A single mistake can lead to losses or reduced profits. So, to prevent such situations... Remember to follow. Feel free to leave me a message if you have any questions.
Solana | Bear Market LeaderAnother outlier similar to $BCHUSD. Price has broken severe lvls of structure on the way down indicating a Year long bear market. This also may indicate that we see BITSTAMP:BTCUSD head for $40k - $30k.
Solana has also formed a similar Bearish Wedge to my last BTC post. If your looking to trade one over the other it seems that SOL would net more since its next support lvl sits at a whopping 45% down ($52 target) but may also see more in that one move.
Remember to keep an eye on the Bearish Elliott Wave that is shown in related posts.
Bitcoin | Continuation DownWe got a solid support zone at ~$52,000 but something tells me we may break through as price action stays consistent on its drawdowns.
1st drawdown from high to low is about 36%
2nd sits around 3% more than the last
3rd drawdown has a possibility of aiming for the same amount
We also have another bearish wedge pattern like the last indicating a continuation down.
Bears are still very strong here and long positions are likely to be liquidated unless if your scalping.
Now if price looks to break below I'm expecting a liquidity grab at the next support lvl (~40.3k).
Stay safe, happy trading :)
Oil Short - slap in the face, rising wedge, bear flagDoesn't make sense logically, but the charts are the footprints in the sand. Looks like downside.
Entry 1
Market (after BAGL break)
SL: 70 high value area (volume)
Entry 2
Limit order Trendline retest
SL at TLT safety line
TP at POC of the larger move.
Bitcoin & Ethereum Short Update: Adjust to Stop-ProfitOver in this short video, I just want to update that the previous idea has been validated and now with the idea deep in the money, we can now adjust the stop to a stop-profit.
Also, I expect this to be just the first leg down and we should see price breaking down the lower trendline.
Good luck!
Selena | XAGUSD · 2H – Channel Accumulation & Reversal SetupTVC:SILVER
After rejecting from the 95.00 resistance area, price moved into a corrective phase and is now testing the demand zone between 78.00 and 81.00. This area aligns with the lower boundary of the channel and represents a key accumulation region. The recent reaction suggests buyers are attempting to regain control after a liquidity sweep below the range lows. If demand holds, price could push back toward the supply zone near 90.00 and potentially break the descending trendline for a bullish continuation.
Key Scenarios
✅ Bullish Case 🚀
Bounce from demand zone.
🎯 Target 1: 85.00
🎯 Target 2: 90.00
🎯 Target 3: 95.00
❌ Bearish Case 📉
Break below demand zone.
🎯 Downside Target 1: 75.00
🎯 Downside Target 2: 70.00
Current Levels to Watch
Resistance 🔴: 88.00 – 90.00
Support 🟢: 78.00 – 81.00
Major Support 🟢: 75.00
⚠️ Disclaimer: This analysis is for educational purposes only. It is not financial advice. Please do your own research before trading.
Platinum Breaking to the Down SidePlatinum has just broken to the downside with 1 full candle confirmation and the next level of support that I see is not until the 200 Week Moving Average (bottom yellow line). I measured a potential 17% drop to the downside after initial breakout. 200 Week Moving Average showing really strong support and bounce upward is highly likely.
Silver Hitting SupportSilver has continued to drop after breaking the wedge formation with a lot of strength but is currently bouncing on support level in the $70 price point.
The RSI currently shows more room to the down side since it has not yet reached the 30 and
hitting the price point target is looking very likely to follow through.
The 200 Week Moving Average which is the yellow SMA line in the bottom of the chart is a strong resistance level which I believe is pulling the candles to it like gravity is most likely to hold if we break the support level in the $70 price point. This level also matches the downside measured move I drew with the original breakout also adding more validity to the projection.
The bounce off the 200 Week moving average will more than likely be be a strong bounce upward due to the RSI reaching oversold territory when reached.
GOLD (XAUUSD): Bearish Move After Breakout
Gold will likely falling today, following a retest of a recently
broken daily horizontal support.
My intraday confirmation is a bearish breakout of a support line
of a rising wedge pattern.
Goal - 4795
❤️Please, support my work with like, thank you!❤️
I am part of Trade Nation's Influencer program and receive a monthly fee for using their TradingView charts in my analysis.
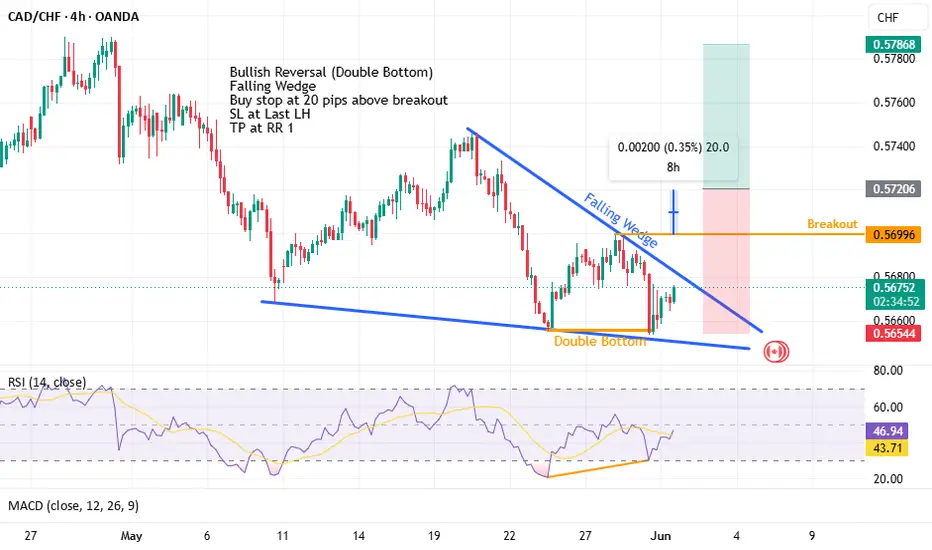
GBPAUD Potential Reversal – Falling WedgeGBPAUD is forming a falling wedge pattern on the H4 timeframe, which often signals a potential bullish reversal. At the same time, bullish divergence on H1 suggests selling momentum may be weakening.
📈 Trade Idea (Breakout Setup)
• Entry: Buy Stop above wedge breakout (~1.8840)
• Stop Loss: 1.8670
• Target: 1.9480 area
The plan is to enter only after a confirmed breakout of the wedge, aligning with the higher timeframe structure. If buyers step in, the pair could push toward the 1.94 resistance zone.
Risk-to-reward approximately 1:2.
Bitcoin Inside a Rising Wedge — Breakout or Breakdown?After the start of the military conflict in the Middle East, Bitcoin( BINANCE:BTCUSDT ) hasn’t performed with strong momentum; instead, it has been trading in a range over these past few days. The question now is whether Bitcoin can make a major move or if it will remain in this price range. So, stay with me.
Right now, Bitcoin is moving in a resistance zone($76,620-$71,700), close to the Cumulative Short Liquidation Leverage($75,650-$74,520).
From a classic technical analysis perspective, it appears that Bitcoin is inside a rising wedge pattern, which is a bearish reversal formation.
From an Elliott Wave theory perspective, it seems that Bitcoin is completing microwave C of the main wave Y within this rising wedge pattern.
I expect that in the coming hours, if conditions align—considering that USDT.D%( CRYPTOCAP:USDT.D )and the S&P 500 index( FX:SPX500 ) are both bullish—Bitcoin could drop again and rise back up at least to $71,100.
Bitcoin’s movements these days are heavily influenced by the Middle East news and the important S&P 500 index. So, it’s better to focus more on short-term moves and, as always, manage your capital carefully.
First Target: $71,100
Second Target: Support zone($70,100-$69,130)
Third Target: $68,437
Stop Loss(SL): $77,133
Points may shift as the market evolves
Cumulative Long Liquidation Leverage: $72,280-$71,490
New CME Gap: $71,845-$71,495
Do you think Bitcoin can reach $80,000, or should we be prepared for another Bitcoin drop? Let me know your thoughts!
💡 Please respect each other's opinions and express agreement or disagreement politely.
📌Bitcoin Analysis (BTCUSDT), 4-hour time frame.
🛑 Always set a Stop Loss(SL) for every position you open.
✅ This is just my idea; I’d love to see your thoughts too!
🔥 If you find it helpful, please BOOST this post and share it with your friends.
AUDNZD: Bullish Outlook Explained 🇦🇺🇳🇿
AUDNZD looks bullish after a retest of a recently broken horizontal
structure support.
A violation of the resistance line of a bullish flag pattern provides
a strong confirmation.
Expect a rise at least to 1.215 level.
❤️Please, support my work with like, thank you!❤️
I am part of Trade Nation's Influencer program and receive a monthly fee for using their TradingView charts in my analysis.
Eliana | XAUUSD · 15m – Range Accumulation & Breakout SetupPEPPERSTONE:XAUUSD OANDA:XAUUSD
After multiple rejections from the 5,030 resistance zone, price retraced into the demand area near 4,970–4,985 where buyers stepped in. The repeated reactions from both range boundaries suggest liquidity buildup on both sides. Currently, price is attempting to move upward from demand, which could lead to a breakout above the range highs. If buy-side liquidity is taken, momentum may accelerate toward higher levels.
Key Scenarios
✅ Bullish Case 🚀
Break above range highs.
🎯 Target 1: 5,040
🎯 Target 2: 5,060
🎯 Target 3: 5,080
❌ Bearish Case 📉
Rejection from resistance again.
🎯 Downside Target 1: 4,990
🎯 Downside Target 2: 4,970
Current Levels to Watch
Resistance 🔴: 5,030 – 5,050
Support 🟢: 4,970 – 4,985
Major Support 🟢: 4,960
⚠️ Disclaimer: This analysis is for educational purposes only. It is not financial advice. Please do your own research before trading.
Selena | XAUUSD · 1H – Descending Structure with Demand ReactionPEPPERSTONE:XAUUSD FOREXCOM:XAUUSD
After a sharp bearish move from the 5,300 region, price respected the descending trendline and continued forming lower highs. Recently, the market swept liquidity below the 4,960 level and tapped into a strong demand zone around 4,980–5,020. This reaction suggests potential accumulation as buyers step in at discounted prices. If momentum builds, price may retrace toward the supply zone near 5,200–5,240. However, the overall structure remains bearish unless a clear break of the descending trendline occurs.
Key Scenarios
✅ Bullish Case 🚀
Bounce from demand zone.
🎯 Target 1: 5,080
🎯 Target 2: 5,150
🎯 Target 3: 5,220
❌ Bearish Case 📉
Failure to hold support.
🎯 Downside Target 1: 4,950
🎯 Downside Target 2: 4,900
Current Levels to Watch
Resistance 🔴: 5,200 – 5,240
Support 🟢: 4,980 – 5,020
Major Support 🟢: 4,950
⚠️ Disclaimer: This analysis is for educational purposes only. It is not financial advice. Please do your own research before trading.
Selena | XAUUSD – 2H – Bullish Structure Holding Above Channel FOREXCOM:XAUUSD PEPPERSTONE:XAUUSD
After a strong impulsive rally, price entered a structured consolidation phase before breaking higher. The recent sharp rejection from the 5,350 supply created a corrective move, sweeping short-term liquidity into demand. This reaction suggests institutional absorption rather than structural weakness. As long as price respects the ascending channel and holds above 5,050, the bullish continuation scenario remains dominant. Liquidity above 5,400 remains the magnet.
Key Scenarios
✅ Bullish Case 🚀 →
🎯 Target 1: 5,322
🎯 Target 2: 5,400
🎯 Target 3: 5,550 – 5,600 liquidity zone
❌ Bearish Case 📉 →
🎯 Downside Target 1: 4,980
🎯 Downside Target 2: 4,838 strong support
Current Levels to Watch
Resistance 🔴: 5,350 – 5,400
Support 🟢: 5,050 – 5,100
⚠️ Disclaimer: For educational purposes only. Not financial advice.
Selena | XAUUSD · 2H – Accumulation Inside Bullish ChannelPEPPERSTONE:XAUUSD FOREXCOM:XAUUSD
After a sharp rejection from the upper resistance zone near 5,400, price retraced back toward the mid-channel support and began consolidating within the accumulation block. This type of consolidation often precedes continuation moves. As long as price remains above the 5,050 structure level, the market maintains bullish potential toward higher liquidity near the previous highs.
Key Scenarios
✅ Bullish Case 🚀
• Hold above 5,050 – 5,100 support
• Break above 5,250 structure
• 🎯 Target 1: 5,380
• 🎯 Target 2: 5,450
• 🎯 Target 3: 5,600
❌ Bearish Case 📉
• Break below 5,050 support
• 🎯 Target 1: 4,980
• 🎯 Target 2: 4,900
• 🎯 Target 3: 4,800
Current Levels to Watch
Resistance 🔴: 5,250 – 5,300
Major Resistance 🔴: 5,380 – 5,420
Support 🟢: 5,050 – 5,100
⚠️ Disclaimer: This analysis is for educational purposes only. Not financial advice.
Selena | USDJPY · 2H – Channel Resistance Liquidity SetupFX:USDJPY
After forming a base around the 152 region, the market established a strong bullish recovery phase and developed a clear ascending channel. The recent move toward the upper trendline indicates a liquidity-driven push targeting previous highs. This region near 159.50 represents a key liquidity pool where smart money may look for profit-taking or distribution. If price sweeps this liquidity and shows rejection, a corrective move toward the lower range could follow.
Key Scenarios
❌ Bearish Case 📉 (Primary Scenario)
Liquidity sweep near 159.50 followed by rejection.
🎯 Target 1: 156.50
🎯 Target 2: 154.00
🎯 Target 3: 152.20
✅ Bullish Case 🚀 (Alternative Scenario)
If price breaks and holds above 159.60.
🎯 Target 1: 160.50
🎯 Target 2: 161.80
Current Levels to Watch
Resistance 🔴: 159.40 – 159.60
Mid Support 🟢: 157.70
Major Support 🟢: 156.30
⚠️ Disclaimer: This analysis is for educational purposes only. It is not financial advice
Selena | BTCUSD · 1H – Ascending Channel Liquidity SetupBITSTAMP:BTCUSD
After the deep liquidity sweep near the 63k region, buyers stepped in strongly and initiated a bullish recovery phase. Price is currently reacting around the 70k supply zone, which has previously acted as a strong reaction area. If the market successfully holds above this region and breaks through the minor resistance levels, the next liquidity target sits near the previous highs around 74k where buy-side liquidity is concentrated.
Key Scenarios
✅ Bullish Case 🚀
Hold above 70,000 support zone
🎯 Target 1: 72,000
🎯 Target 2: 74,000
🎯 Target 3: 76,000
❌ Bearish Case 📉
Rejection below 70,000 resistance
🎯 Downside Target 1: 68,000
🎯 Downside Target 2: 66,500
Current Levels to Watch
Resistance 🔴: 72,000 – 74,000
Major Resistance 🔴: 75,000 – 76,000
Support 🟢: 70,000
Major Support 🟢: 68,000
⚠️ Disclaimer: This analysis is for educational purposes only. It is not financial advice.
Selena | XAUUSD · 30m – Ascending Structure With Demand ReactionFOREXCOM:XAUUSD PEPPERSTONE:XAUUSD
After rejecting from the major resistance around 5,400, price entered a corrective phase and began consolidating within a rising structure. The current pullback is approaching a key demand zone between 5,090 and 5,120 which aligns with the lower boundary of the channel. This confluence of trendline support and demand zone increases the probability of a bullish reaction if buyers defend the level. A successful bounce from this area could push price back toward the upper channel boundary and the buy-side liquidity resting above the previous highs.
Key Scenarios
✅ Bullish Case 🚀
Demand zone holds.
🎯 Target 1: 5,240
🎯 Target 2: 5,320
🎯 Target 3: 5,400
❌ Bearish Case 📉
Break below channel support.
🎯 Downside Target 1: 5,020
🎯 Downside Target 2: 4,960
Current Levels to Watch
Resistance 🔴: 5,240
Major Resistance 🔴: 5,400
Support 🟢: 5,090 – 5,120
Major Support 🟢: 5,020
⚠️ Disclaimer: This analysis is for educational purposes only. It is not financial advice.