FOMC : Our catalyst to drive GOLD to 3800?No more waiting around , the day we have all been waiting for is finally upon us. ITS FOMC DAY which equals volatility, so you better brace yourself.
Looking at the one hour timeframe on XAUUSD, our first major warning sign that price might move lower is the lower high made in the 4150$ region. Ever since , price has been moving in a descending wedge. Now since we have failed to make a move higher than 4200$, then this suggests that the most likely move is to the downside.
Possible targets a
Wedge
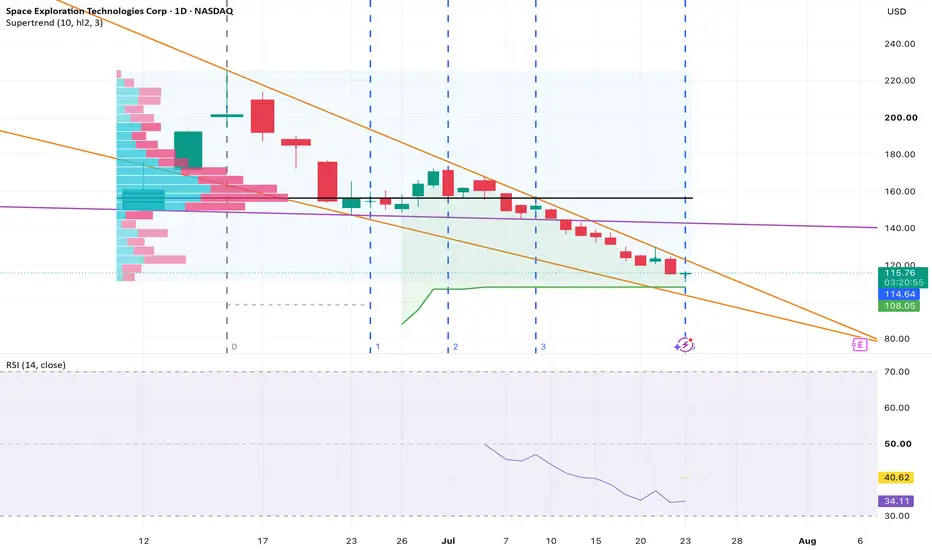
SPCX should go higherI recently visited The Kennedy Space Center Visitor Complex and had a chat with an astronaut about the Perseverance and Curiosity rovers. At some point, he mentioned he'd recently talked to Elon about SpaceX and was told Elon wanted to land his rockets in the ocean to help generate coral reefs. Interesting! I also realized how frequently SpaceX was on display throughout the complex. I couldn't stop thinking any investment in SPCX will have a decent ROI in the future.
That said, the stock took a
AUDUSD 1H: Buyer Stop-Loss Sweep & Reversal Plan1. Market Context
AUDUSD is squeezing inside a parallel channel, pressing against the horizontal support floor at 0.69660. Retail buyers are repeatedly buying at this support, leaving a heavy pool of stop-loss orders exposed directly beneath.
2. Casino / House Trap Analysis
• Buyer Stop-Loss Trap: Retail traders buying at 0.69660 ("Buyer") have clustered their stop-losses inside the "Stoploss Zone Of Buyer" around 0.69504 and 0.69300.
• House Manipulation Drive: The House will push price down b
Dollar Index (DXY): Pullback From Resistance $
There is a high chance that Dollar Index will retrace from a key
daily resistance cluster.
A confirmed breakout of a support line of a rising wedge pattern
on an hourly time frame provides a strong signal.
Goal - 101.4
❤️Please, support my work with like, thank you!❤️
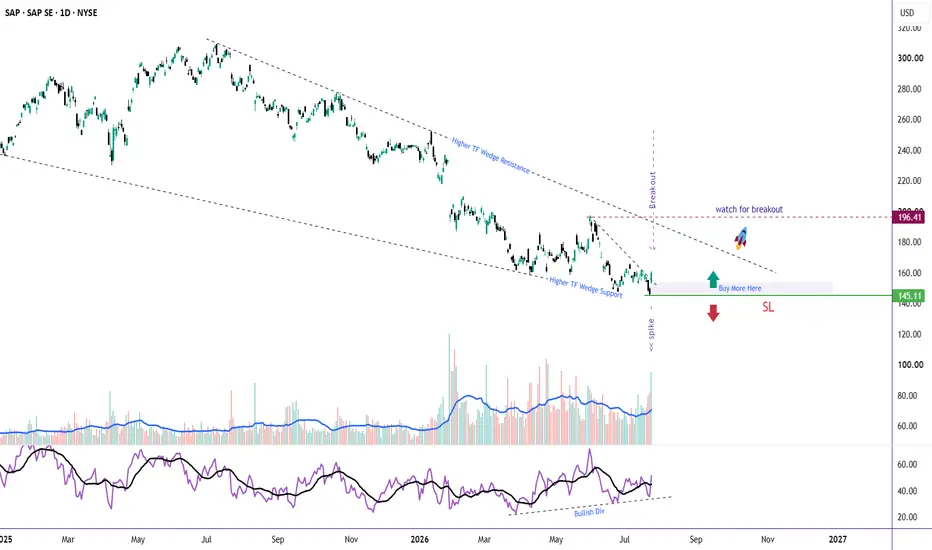
SAP: Bullish Reversal or Setting a Trap?SAP delivered strong earnings, and the market responded with conviction. The stock surged on exceptionally high volume, breaking out of its short-term downtrend—a sign that institutional buyers may be stepping back in.
But there's a bigger story unfolding.
📊 The Story
After almot a year of correcting within a higher-timeframe falling wedge, SAP has finally shown its first meaningful sign of strength.
The recent breakout came with:
🟢 A strong volume spike, adding credibility to the move.
🟢 B
EURJPY - High-Confluence Resistance AheadEURJPY is approaching a high-confluence resistance area, where multiple technical factors are aligning to create a potential overbought zone. 📉
Price is now testing the intersection of:
The red supply zone.
The upper blue trendline, acting as dynamic resistance.
📌 As long as this confluence continues to hold, we will be looking for trend-following short setups, expecting sellers to defend the area and the broader correction to resume.
As always, rather than selling blindly into resistance, w
Capital is being destroyed in ETH vs SPXLet alone a simple savings account in the bank!
The Sentiment Shift:
The "developer-led revolution" was the narrative that underpinned Ethereum's ascent.
But look at the data in 2026—the researchers, the builders, and the early evangelists aren't staying to build.
They are migrating to ecosystems that provide actual utility, scalability, and integration with the real-world financial infrastructure.
The ETH/SPX Divergence:
When you plot ETH against the S&P 500, you don't just see a correction
CRO’s Next Move Could Trap Everyone…!Yello Paradisers! Are you prepared for a potential sharp move on #CRO, or are you still underestimating what’s quietly building behind the scenes? At first glance, this structure might seem like a simple and healthy pullback. But when we strip away emotions and analyse the chart objectively, a completely different narrative emerges. This is not random price action this is a high-risk, high-opportunity zone where discipline matters far more than opinions.
💎#CRO is starting to take support from t
QQQ: Diamond formation in play; 8% move down next?The QQQ might just have confirms the diamond formation which is sending major warning signals :
QQQ recently broke below the diamond formation towards 693$ , went back up to retest 708$ and now is back down. This is sending a signal : confirmation of the diamond pattern and a potential move lower.
Looking at possible targets by taking the high of the diamond pattern to the low , this takes us to the 636$ , an 8% move down. This level happens to coincide with the 50% and 618% of the entire mov
BLDR: Bullish Divergence at Lower-Wedge SupportBuilders FirstSource is testing the lower boundary of a long-term falling wedge while daily RSI continues to show bullish multi-swing divergence, suggesting downside momentum may be weakening.
This is a countertrend long idea, so confirmation matters. I would want to see a bullish reversal off wedge support along with a bullish stochastic cross to strengthen the bounce thesis. It's beginning to show some signs of Volume Divergence as well.
Key levels I’m watching:
Current wedge support: ~$67.
Elliott wave analysis for NAS100.28187.2 held as support on 17 July, consistent with a diagonal (red ellipse). However, price action from that bounce does not appear impulsive, but rather a double three (W is zigzag, Y is regular flat).
Given this development, I see two possible scenarios:
1) 28187.2 holds as support and price goes for a (c) wave towards 30000, or
2) 28187.2 breaks on volume and confirms that the red ellipse is
a leading rather than an ending diagonal, suggesting price to go lower quickly, with targets includi
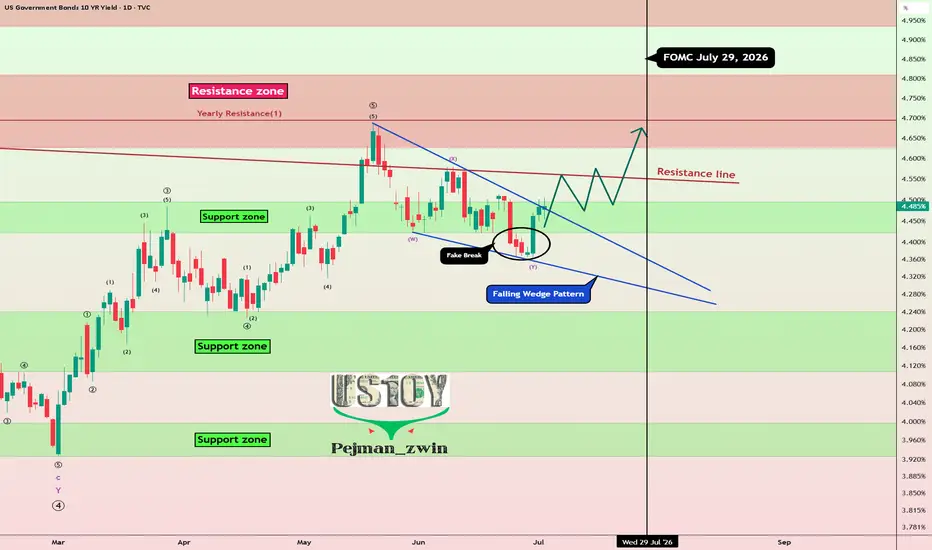
US10Y Fake Break:Is a New Bond Yield Rally About to Shake MarketToday, I want to analyze the U.S. 10-Year Government Bond Yield ( TVC:US10 ), as it is one of the key financial market indices that can show us the broader market direction for various assets like Gold ( OANDA:XAUUSD ), Silver ( OANDA:XAGUSD ), U.S. stock indices (including the S&P 500 ( FOREXCOM:SPX500 )), and especially Bitcoin ( BINANCE:BTCUSDT ) in the crypto market. Stay with me.
On the daily timeframe, the U.S. 10-Year Government Bond Yield is currently moving near a support zone (4.
S&P 500 at Potential Reversal Zone—Is a Bigger Correction Next?The S&P 500 ( FOREXCOM:SPX500 ) reacted strongly to the recent support zone($7,463-$7,430) and Support Lines, which led to another bullish move. However, the index is currently trading near the key trading level of $7,500 and the Potential Reversal Zone (PRZ) .
From an Elliott Wave perspective, Wave C appears to have been completed through an Ending Diagonal pattern. The lower trendline of this pattern has already been broken, and the S&P 500 is currently pulling back to retest it.
I expect t
USDJPY: Bullish Trend Continuation 🇺🇸🇯🇵
As I predicted earlier, USDJPY successfully violated a resistance
cluster based on the current all-time high.
The broken structure turns into a potentially strong support now.
We can expect that the pair will rise more and reach at least 163.5 level.
For entries, I will look for a pullback and an occasional retest.
❤️Please, support my work with like, thank you!❤️
I am part of Trade Nation's Influencer program and receive a monthly fee for using their TradingView charts in my analysis.
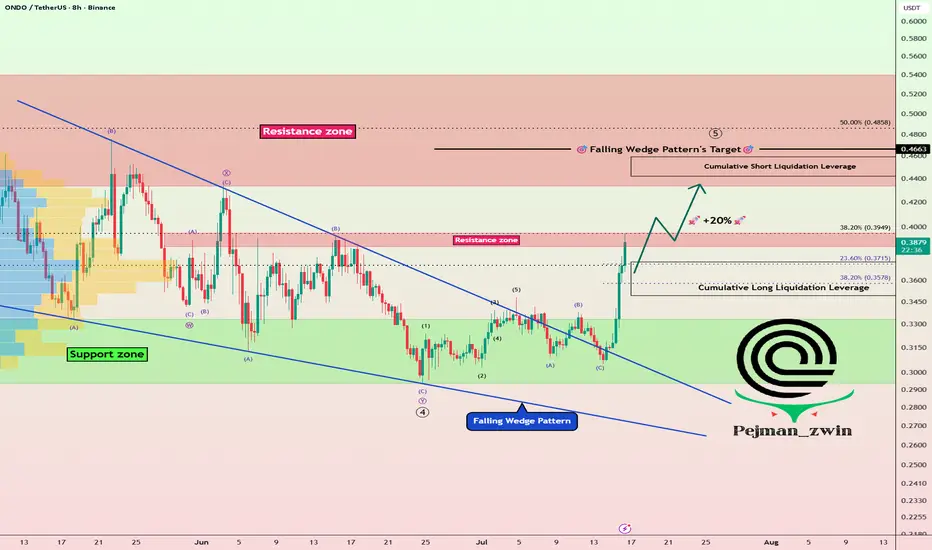
ONDO Breakout After Major RWA News — Is Another 20% Rally Next?Ondo ( BINANCE:ONDOUSDT ) surged over 17–20% on July 15–16, 2026, primarily driven by a major institutional milestone: the launch of tokenized stock representations backed by DTCC’s Tokenization Service (the largest U.S. securities clearinghouse).
This development creates real “digital twins” of DTC-held securities (such as SPY and CRCL) on-chain, marking a significant step in bridging traditional finance infrastructure with blockchain. Combined with the ongoing strong RWA narrative and previo
NZDJPY: Bullish Continuation 🇳🇿🇯🇵
NZDJPY completed a consolidation within a bullish flag pattern,
breaking its upper boundary.
The market will likely continue rising and reach 0.9534 level.
❤️Please, support my work with like, thank you!❤️
I am part of Trade Nation's Influencer program and receive a monthly fee for using their TradingView charts in my analysis.
Options Blueprint [int]: When Price Is Trapped, Think VolatilityMarkets do not always reward directional conviction. Sometimes, the highest-probability observation is simply that price appears compressed and a meaningful move could emerge in either direction. Rather than attempting to predict whether buyers or sellers will ultimately prevail, traders can instead prepare for volatility itself.
This case study explores how a Long Strangle options strategy may be combined with a classical chart pattern, implied volatility analysis, and predefined technical obj