Selena | XAUUSD 2H – Bullish Recovery Setup From Major SupportFOREXCOM:XAUUSD PEPPERSTONE:XAUUSD
Structure | Trend | Key Reaction Zones
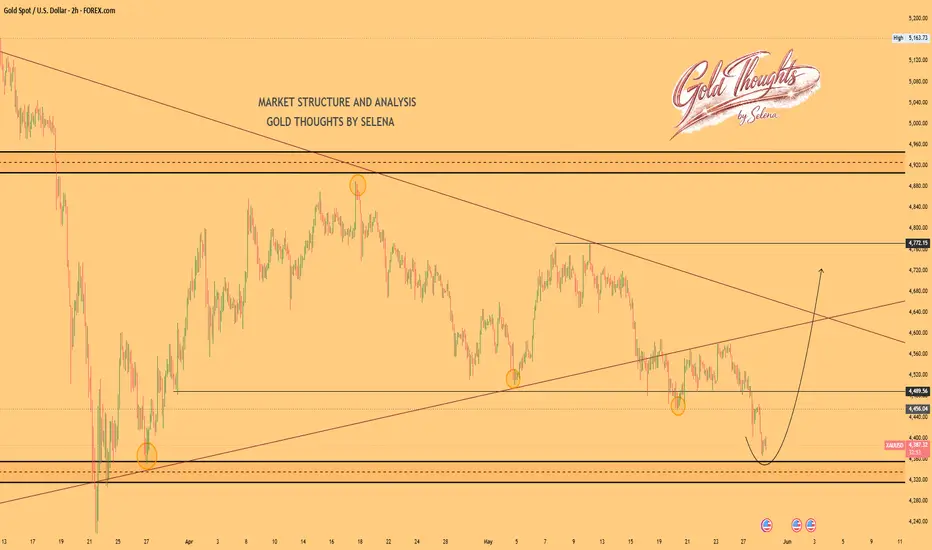
Gold is currently reacting from a strong higher timeframe demand zone while respecting the ascending support trendline. The chart structure suggests bullish recovery momentum building from support.
Market Overview
After extended bearish pressure, price has reached a key liquidity and support area where buyers previously entered the market aggressively. The projected path indicates a possible bullish rebound toward higher resistance and dynamic supply zones.
Bullish Scenario 🚀
🎯 Target 1: 4520
🎯 Target 2: 4640
🎯 Target 3: 4720
Current Levels to Watch
Resistance 🔴: 4520 → 4720
Support 🟢: 4320 → 4380
⚠️ Disclaimer: This analysis is for educational purposes only. It is not financial advice.
Wedge
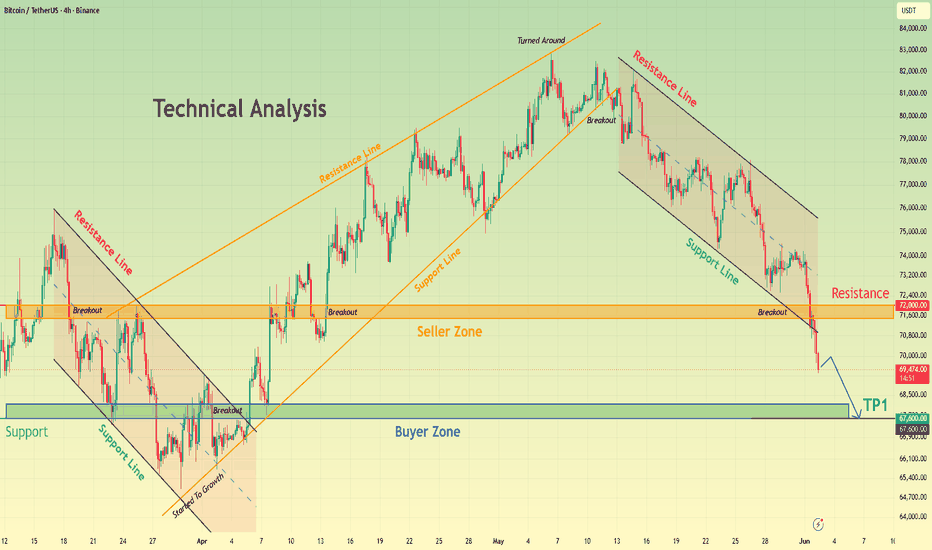
Bitcoin Analysis - Next Stop 67,600 After Major BreakdownHello traders! Here’s my technical outlook on BTCUSDT (4H) based on the current chart structure. BTC previously recovered from a major Buyer Zone near 67,600 after breaking out of a descending channel. The recovery evolved into a strong bullish trend, supported by an ascending channel that carried price toward a major swing high around 82,000. After reaching that pivot area, bullish momentum faded and BTC reversed lower. Currently, BTC has broken below both the channel support and the 72,000 Seller Zone, confirming renewed bearish pressure. The former support area is now acting as resistance. As long as BTC remains below 72,000, the bearish outlook stays valid. A continuation lower could send price toward the 67,600 Buyer Zone (TP1), which is the next key demand area. Please share this idea with your friends and click “Boost” 🚀
Falling Wedge on XRP should breakout Q2 or Q3 at the latest.If the weekly 200ma (in blue) can maintain support then we should see a breakout no later than June. 2 possible bottom trendlines of the falling wedge here currently in play, with the purple one allowing for price to dip slightly lower and for the wedge to take slightly longer to breakout. *not financial advice*
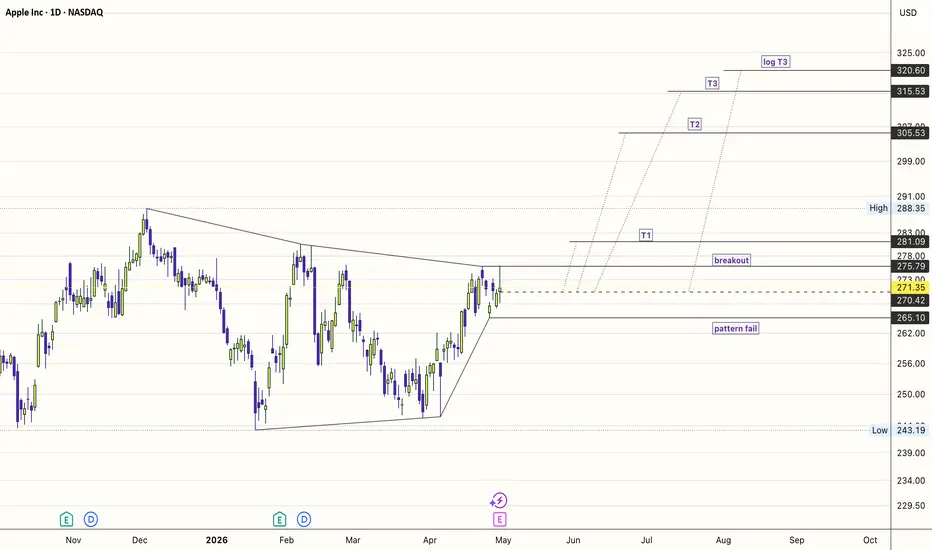
$APPL: HUNT VOLATILITY FUNNEL --- NEW HIGH TARGETS"Apple has a stellar balance sheet and sends great amounts of cash flows back to shareholders." _ Morningstar
pre market moves is likely to trigger this #HVF @TheCryptoSniper
look for a retest of the funnel if you don't want to chase. Or a Pause at Target 1
But in this market environment it is quite likely to run with vigor.
All adding fuel for the #SPX to continue this rally through summer.
Bitcoin Bearish Flag Formation and Market Manipulation Concerns👋 Hi, in my opinion, Bitcoin has formed a bearish flag 🚩📉.
Mr. Solh D.J.T. and his team 🤵♂️, contrary to their promises 🤥✋, have crashed the market 💥📊 by starting wars ⚔️🌍 and made huge profits from futures trading 💰📈.
Now, if the market continues to drop with the same steep and powerful slope 📉⚡, it could even fall as much as the flagpole's length 🏴☠️📏 — down to around $30,000 💸😱.
EURUSD Short: Rejected at Major Trendline, Bears Target 1.1630Hello traders! Here’s my technical outlook based on the current EURUSD (3H) chart structure. EURUSD previously traded below a long-term descending trendline and formed a rounding top pattern after rejecting from a major pivot high.
Currently, EURUSD is trading above the 1.1630 demand zone while remaining below the 1.1670 supply zone, which continues to act as the key resistance area. Price recently retested the descending trendline near a pivot point and faced another rejection, signaling that sellers remain active despite the recovery from support.
As long as EURUSD remains below the 1.1670 supply zone and continues to respect the descending trendline resistance, the bearish scenario remains valid. A continuation lower could push price toward the 1.1630 demand zone (TP1). Manage your risk!
EURUSD Trendline Rejection Could Trigger Move Back to 1.1630Hello traders! Here’s my technical outlook based on the current EURUSD (1H) chart structure. EURUSD previously traded inside a descending channel after reversing from a major high. Following several breakdowns below support, price found demand near the 1.1630 buyer zone and started forming a recovery structure above the ascending support line. Currently, EURUSD is trading below the 1.1680 seller zone while holding above the 1.1630 buyer zone, which continues to act as the key support area. Price recently rebounded from the support line and is now approaching the descending trendline resistance after breaking out of the recent consolidation range. As long as EURUSD remains below the 1.1680 resistance zone and continues to respect the descending trendline resistance, the bearish scenario remains valid. A rejection from the current area could push price back toward the 1.1630 buyer zone (TP1). Please share this idea with your friends and click “Boost” 🚀
USDCHF – Bearish Pressure Building at Resistance?USDCHF is approaching a strong confluence zone where the upper bound of its falling wedge pattern intersects with a major resistance zone marked in red. 🔴
This area has already proven its importance multiple times in the past, making it a key decision point for the pair.
As long as this resistance intersection holds, we will be looking for shorts, anticipating another bearish leg lower within the overall corrective structure. 📊
The falling wedge remains intact for now, and sellers continue to defend the upper boundary of the pattern.
A clear rejection from this zone could provide the trigger for the next bearish impulse. ⚡
Will the bears defend resistance once again? 🤔
⚠️ Disclaimer: This is not financial advice. Always do your own research and manage risk properly.
📚 Stick to your trading plan regarding entries, risk, and management.
Good luck! 🍀
All Strategies Are Good; If Managed Properly!
~Richard Nasr
OPEN - Falling Wedge Breakout After 7 Months of ConsolidationThe structure formed in OPEN since November 2025 is a falling wedge, a classic bullish pattern that breaks upward in approximately 70% of cases. The measured target for a falling wedge typically points to a return to the start of the pattern, around the $9.50 area. Intermediate horizontal resistance levels that may serve as partial profit-taking zones include $5.50, $6.00, $6.50, and $7.50. The primary risk is a failed breakout that returns price into the wedge. A daily close below $4.80 in the coming days would invalidate the thesis.
Not investment advice.
NEARUSD Showing Early Signs of Reversal from Key SupportNEARUSD retested the 2023 lows, but notice that a decline is overlapped, which indicates a wedge pattern within wave C of a higher degree ABC correction from the highs. It's actually already trying to wake up from the projected 0.80 support area, but to confirm support in place, we have to see an impulsive recovery back above the upper wedge line near the 1.90 level. First bullish evidence is above 3.35 level. Invalidation level is at 0.51.
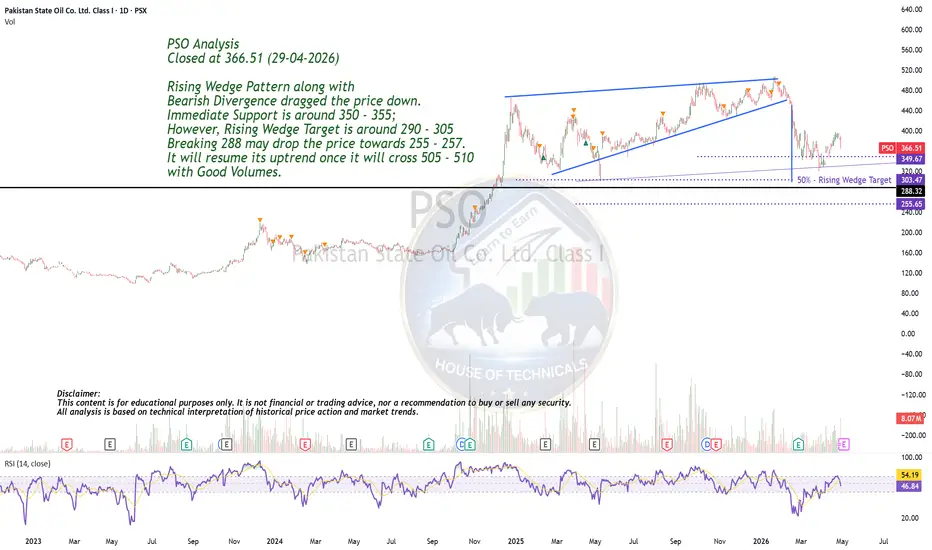
Rising Wedge PatternPSO Analysis
Closed at 366.51 (29-04-2026)
Rising Wedge Pattern along with
Bearish Divergence dragged the price down.
Immediate Support is around 350 - 355;
However, Rising Wedge Target is around 290 - 305
Breaking 288 may drop the price towards 255 - 257.
It will resume its uptrend once it will cross 505 - 510
with Good Volumes.
JUP Update (12H)Since I shared JUP in my previous analysis, JUP did exactly what was expected.
Now there is a possibility for JUP to make another rally.
Many altcoins like LBA (veya hangi coin ise), XLM, etc. are doing the same.
Simple range, breakout test, second accumulation, and breakout.
After JUP cleaned its liquidity areas, the downside momentum has slowed down.
Take a closer look at the volume profile I marked on the right side of the chart.
It simply shows that whoever wants JUP at a higher price already bought it around the first range zone.
Watch the $0.20 area closely; if it breaks, JUP will climb higher.
Thanks for reading.
PALU/USDT – Falling Wedge Breakout, +50% TargetPALU/USDT has been forming a clear falling wedge pattern on the 15-minute chart since its peak above 0.003600. Price is now approaching the apex of the wedge near current levels (~0.002195), with RSI 14 sitting at a neutral ~51 leaving plenty of room for upside momentum.
WARD/USDT – Bullish RSI Divergence Inside Falling WedgeWARD/USDT is printing a textbook bullish setup on the 15-minute chart: a falling wedge pattern combined with a clear bullish RSI divergence. While price has been making lower lows, RSI (14) has been forming higher lows near the oversold zone (~30), signaling weakening bearish momentum and a potential reversal.
CRWV Likes falling wedgeCRWV is beautifully moving in a round bottom shape. It turned bullish since it hit 138. This recent pullback after hitting 138 is a rather buying opportunity. Price has been consolidating in another falling wedge and recently broken out and tested the breakout area near 100. It is bullish as long as it doesn't close below 95 on daily TF. It is likely going to retest 138 again, and breakout will lead to immediate strong resistance at 153. My long term biase will be bullish towards 187 (ATH retest, and I would expect it to hit 240s.
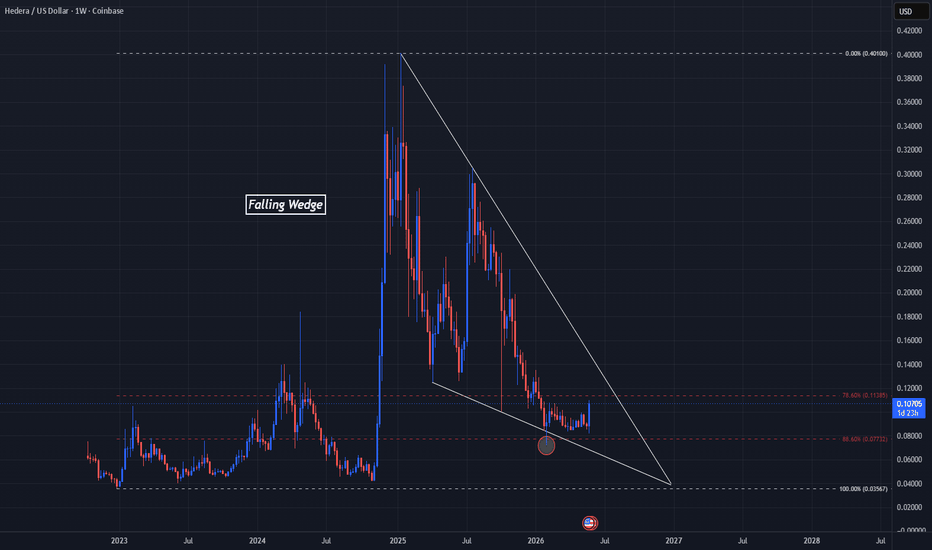
HBAR's Deep Retracement May Be An End To The WedgeCOINBASE:HBARUSD has made leaps and bounds not only in a Technical standpoint, but Fundamentally as well, lets break it down!
Hedera on the Weekly chart has formed what looks to be a Falling Wedge and overlaying a Fibonacci Retracement Tool from the Low of .03 in 2022 to the All Time High of .40, we can see, while price has traded within the pattern, has made an 88.6% retracement and could be pointing to the end of price continuing to fall.
There is still room for price to move to the upside around .14 until we can get the expected proper Bullish Breakout of the pattern.
Once a Breakout happens and a Retest is successful, we can assume that the Breakout move will be equal to that of the price movement of the "Flagpole" or rally in price prior to it falling into the Consolidation Phase it is in now!
Fundamentally, COINBASE:HBARUSD makes sense as a great Alt-coin to invest in with the expansive list of partnerships with Hederas Governing Council like:
- IBM
- Google
- Accenture
- McLaren
- FedEx
- LG
and the list goes on!
Most recently, COINBASE:HBARUSD has made an extension into the Japanese eco-system with being listed on OKCoin.
- www.tradingview.com
Let's not forget, COINBASE:HBARUSD was also 1 of the 16 coins that received "Digital Commodity" status and with the CLARITY Act also helping clear uncertainty in the crypto space with the SEC, COINBASE:HBARUSD should definitely be a coin of interest!
CEG long coming CEG is prepping for a blastoff here as the market is generally bullish. The market sleeps on this play that has a baseline 13% EPS growth with nuclear credits. Any performance from the management team and we sit closer to 20% EPS growth which is an easy double by 2030. Their recent purchase of Calpine allows them to have natural gas exposure to offset nuclear refueling times. They are now the largest private energy provider in the US. Private providers have higher margins and less regulation.
Bajaj Auto Testing ResistanceDaily Timeframe Analysis of Bajaj Auto
The stock is currently facing a strong resistance zone near 10,800 – 10,900 levels. Price action indicates that sellers are active around this area, making it a crucial zone for the next directional move.
For bearish momentum confirmation, a breakdown below the 10,300 support level could trigger further downside pressure, with the stock potentially correcting towards the 10,040 zone in the coming sessions.
View remains bearish until the resistance zone is decisively breached.
Thank You !!
USDJPY: Strong Intraday Confirmation?! 🇺🇸🇯🇵
A quick follow-up for USDJPY.
I see a confirmed breakout of a resistance line of a bullish flag pattern
on an hourly time frame after a retest of a strong support.
We can expect a price rise to 159.45 level.
❤️Please, support my work with like, thank you!❤️
I am part of Trade Nation's Influencer program and receive a monthly fee for using their TradingView charts in my analysis.