OPEN-SOURCE SCRIPT
업데이트됨 Triple Momentum Extremes
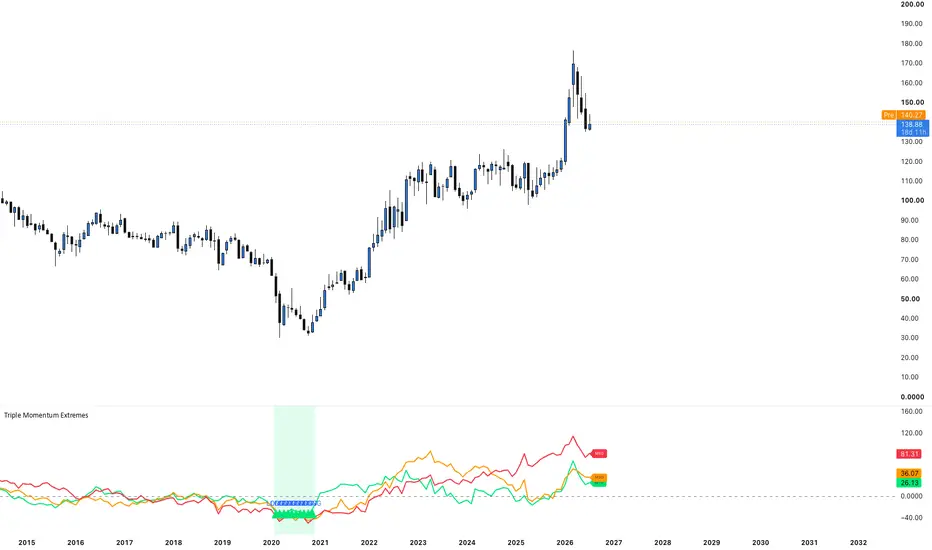
# Triple Momentum Extremes
**Triple Momentum Extremes** is a multi-timeframe momentum exhaustion indicator designed to identify statistically rare momentum extremes rather than traditional momentum trends.
Instead of using momentum as a trend-following tool, this indicator looks for situations where **all three momentum periods (10, 30, and 60)** simultaneously reach extreme levels within their own historical distribution. These conditions often indicate that the market may be approaching an exhaustion point.
## Features
* Displays **Momentum 10, 30, and 60** in a single pane.
* Uses **Percent Rank** to normalize momentum values across different market conditions.
* Adjustable **Extreme Threshold (%)** to control signal sensitivity.
* Individual signal selection:
* Long signals only
* Short signals only
* Long & Short signals
* Compact labels (M10, M30, M60) for quick identification.
* Built-in alert conditions for both Long and Short signals.
## How It Works
Each momentum line is converted into a **Percent Rank** over a configurable historical lookback period.
A **Long signal** is generated when:
* MOM10 is within the lowest X% of its historical range.
* MOM30 is within the lowest X% of its historical range.
* MOM60 is within the lowest X% of its historical range.
A **Short signal** is generated when:
* MOM10 is within the highest X% of its historical range.
* MOM30 is within the highest X% of its historical range.
* MOM60 is within the highest X% of its historical range.
The threshold (default 10%) can be adjusted to make signals more selective or more frequent.
## Interpretation
This indicator is primarily designed as a **mean-reversion tool**.
When momentum reaches simultaneous extremes across multiple time horizons, the probability of an exhausted move increases. Such conditions can highlight potential reversal zones or areas where traders should prepare for a change in market behavior.
In many markets—especially equities and cryptocurrencies—extreme negative momentum has historically produced stronger reversal opportunities than extreme positive momentum. Strong bullish momentum can often persist for extended periods, while deeply negative momentum more frequently precedes relief rallies.
For this reason, many traders may prefer using **Long signals only**, while treating Short signals as secondary confirmation rather than standalone entries.
## Best Use
The indicator works best when combined with:
* Support and resistance levels
* Market structure
* Volume analysis
* Candlestick confirmation
* Trend filters
It is intended to identify **high-probability exhaustion zones**, not automatic buy or sell signals.
As with any technical indicator, it should be used as part of a broader trading strategy and proper risk management.
**Triple Momentum Extremes** is a multi-timeframe momentum exhaustion indicator designed to identify statistically rare momentum extremes rather than traditional momentum trends.
Instead of using momentum as a trend-following tool, this indicator looks for situations where **all three momentum periods (10, 30, and 60)** simultaneously reach extreme levels within their own historical distribution. These conditions often indicate that the market may be approaching an exhaustion point.
## Features
* Displays **Momentum 10, 30, and 60** in a single pane.
* Uses **Percent Rank** to normalize momentum values across different market conditions.
* Adjustable **Extreme Threshold (%)** to control signal sensitivity.
* Individual signal selection:
* Long signals only
* Short signals only
* Long & Short signals
* Compact labels (M10, M30, M60) for quick identification.
* Built-in alert conditions for both Long and Short signals.
## How It Works
Each momentum line is converted into a **Percent Rank** over a configurable historical lookback period.
A **Long signal** is generated when:
* MOM10 is within the lowest X% of its historical range.
* MOM30 is within the lowest X% of its historical range.
* MOM60 is within the lowest X% of its historical range.
A **Short signal** is generated when:
* MOM10 is within the highest X% of its historical range.
* MOM30 is within the highest X% of its historical range.
* MOM60 is within the highest X% of its historical range.
The threshold (default 10%) can be adjusted to make signals more selective or more frequent.
## Interpretation
This indicator is primarily designed as a **mean-reversion tool**.
When momentum reaches simultaneous extremes across multiple time horizons, the probability of an exhausted move increases. Such conditions can highlight potential reversal zones or areas where traders should prepare for a change in market behavior.
In many markets—especially equities and cryptocurrencies—extreme negative momentum has historically produced stronger reversal opportunities than extreme positive momentum. Strong bullish momentum can often persist for extended periods, while deeply negative momentum more frequently precedes relief rallies.
For this reason, many traders may prefer using **Long signals only**, while treating Short signals as secondary confirmation rather than standalone entries.
## Best Use
The indicator works best when combined with:
* Support and resistance levels
* Market structure
* Volume analysis
* Candlestick confirmation
* Trend filters
It is intended to identify **high-probability exhaustion zones**, not automatic buy or sell signals.
As with any technical indicator, it should be used as part of a broader trading strategy and proper risk management.
릴리즈 노트
**Update v1.1**- Added optional **RSI/ATR screener filter** (`RSI14 < threshold`, `ATR14% > threshold`) with fully configurable inputs.
- Added optional **EMA 50/200 cross confirmation** for signals.
- All new filters are toggleable in settings and only affect signals when enabled.
- Default values: **RSI = 35**, **ATR = 3%**, **EMA filter = OFF**.
오픈 소스 스크립트
트레이딩뷰의 진정한 정신에 따라, 이 스크립트의 작성자는 이를 오픈소스로 공개하여 트레이더들이 기능을 검토하고 검증할 수 있도록 했습니다. 작성자에게 찬사를 보냅니다! 이 코드는 무료로 사용할 수 있지만, 코드를 재게시하는 경우 하우스 룰이 적용된다는 점을 기억하세요.

면책사항
해당 정보와 게시물은 금융, 투자, 트레이딩 또는 기타 유형의 조언이나 권장 사항으로 간주되지 않으며, 트레이딩뷰에서 제공하거나 보증하는 것이 아닙니다. 자세한 내용은 이용 약관을 참조하세요.
오픈 소스 스크립트
트레이딩뷰의 진정한 정신에 따라, 이 스크립트의 작성자는 이를 오픈소스로 공개하여 트레이더들이 기능을 검토하고 검증할 수 있도록 했습니다. 작성자에게 찬사를 보냅니다! 이 코드는 무료로 사용할 수 있지만, 코드를 재게시하는 경우 하우스 룰이 적용된다는 점을 기억하세요.
면책사항
해당 정보와 게시물은 금융, 투자, 트레이딩 또는 기타 유형의 조언이나 권장 사항으로 간주되지 않으며, 트레이딩뷰에서 제공하거나 보증하는 것이 아닙니다. 자세한 내용은 이용 약관을 참조하세요.