OPEN-SOURCE SCRIPT
Daily Key Levels + Weekly Year Opens v2.5 OPEN SOURCE
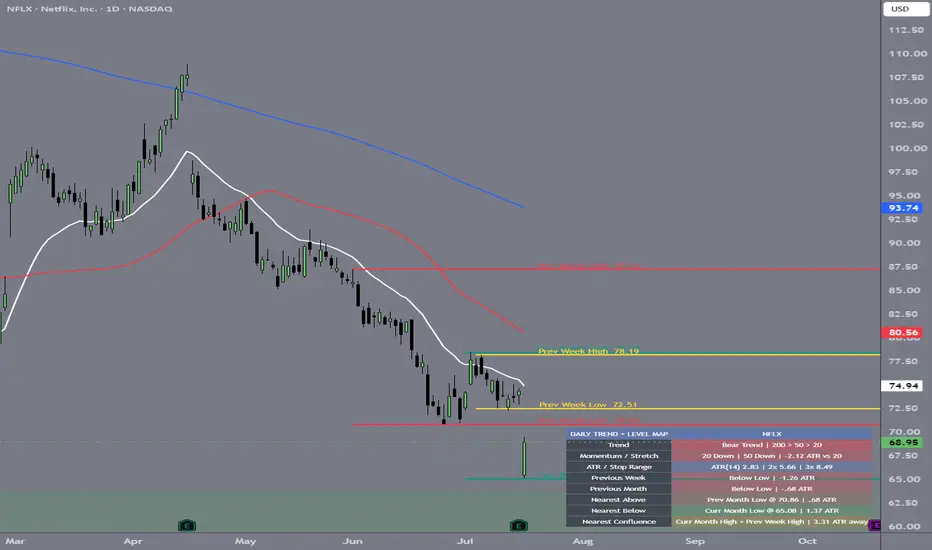
DAILY KEY LEVELS + WEEKLY YEAR OPENS
A clean higher-timeframe map that automatically changes with the chart.
AUTOMATIC DAILY AND WEEKLY PROFILES
This indicator is built specifically for 1D and 1W charts. It detects the chart timeframe and switches profiles automatically.
On a 1D chart, it displays the important weekly and monthly levels, the daily moving averages, and the Daily Trend + Level Map.
When the chart is changed to 1W, the daily profile is removed and the indicator automatically switches to the yearly-open profile. No manual setting changes are required when moving between daily and weekly charts.
On other timeframes, a small notice appears instead of displaying the wrong profile.
DAILY CHART PROFILE
The daily chart includes Previous Month High and Low, Current Month High and Low, and Previous Week High and Low. It also plots the 20 EMA in white, 50 SMA in red, and 200 SMA in blue.
Previous week and previous month levels are confirmed after those periods close. Current month levels continue developing as the month trades.
The compact dashboard adds practical context without taking over the chart. It shows:
Trend, based on price location and the exact order of the 20 EMA, 50 SMA, and 200 SMA.
Momentum / Stretch, including the direction of the 20 EMA and 50 SMA and price's distance from the 20 EMA in ATR units.
ATR / Stop Distance, showing the current daily ATR plus 2x and 3x ATR reference distances. These are volatility measurements, not automatic stop recommendations.
Previous Week and Previous Month, showing whether price is above, below, or inside each completed range.
Nearest Above, Nearest Below, and Nearest Confluence, identifying the closest enabled levels and measuring their distance in daily ATR.
WEEKLY CHART PROFILE
On a weekly chart, the indicator automatically displays the current yearly open and the previous four yearly opens.
By default, all yearly opens extend into the current chart area and include the calendar year and exact price. An optional Year Segments mode is available for traders who prefer each open to remain within its original calendar year.
PURPOSE
The daily profile provides a clear view of trend structure, volatility, nearby support and resistance, and level confluence. The weekly profile provides a simple long-term map of yearly opening prices.
Levels, colors, labels, moving averages, ATR settings, confluence distance, and dashboard placement can all be customized.
A clean higher-timeframe map that automatically changes with the chart.
AUTOMATIC DAILY AND WEEKLY PROFILES
This indicator is built specifically for 1D and 1W charts. It detects the chart timeframe and switches profiles automatically.
On a 1D chart, it displays the important weekly and monthly levels, the daily moving averages, and the Daily Trend + Level Map.
When the chart is changed to 1W, the daily profile is removed and the indicator automatically switches to the yearly-open profile. No manual setting changes are required when moving between daily and weekly charts.
On other timeframes, a small notice appears instead of displaying the wrong profile.
DAILY CHART PROFILE
The daily chart includes Previous Month High and Low, Current Month High and Low, and Previous Week High and Low. It also plots the 20 EMA in white, 50 SMA in red, and 200 SMA in blue.
Previous week and previous month levels are confirmed after those periods close. Current month levels continue developing as the month trades.
The compact dashboard adds practical context without taking over the chart. It shows:
Trend, based on price location and the exact order of the 20 EMA, 50 SMA, and 200 SMA.
Momentum / Stretch, including the direction of the 20 EMA and 50 SMA and price's distance from the 20 EMA in ATR units.
ATR / Stop Distance, showing the current daily ATR plus 2x and 3x ATR reference distances. These are volatility measurements, not automatic stop recommendations.
Previous Week and Previous Month, showing whether price is above, below, or inside each completed range.
Nearest Above, Nearest Below, and Nearest Confluence, identifying the closest enabled levels and measuring their distance in daily ATR.
WEEKLY CHART PROFILE
On a weekly chart, the indicator automatically displays the current yearly open and the previous four yearly opens.
By default, all yearly opens extend into the current chart area and include the calendar year and exact price. An optional Year Segments mode is available for traders who prefer each open to remain within its original calendar year.
PURPOSE
The daily profile provides a clear view of trend structure, volatility, nearby support and resistance, and level confluence. The weekly profile provides a simple long-term map of yearly opening prices.
Levels, colors, labels, moving averages, ATR settings, confluence distance, and dashboard placement can all be customized.
오픈 소스 스크립트
트레이딩뷰의 진정한 정신에 따라, 이 스크립트의 작성자는 이를 오픈소스로 공개하여 트레이더들이 기능을 검토하고 검증할 수 있도록 했습니다. 작성자에게 찬사를 보냅니다! 이 코드는 무료로 사용할 수 있지만, 코드를 재게시하는 경우 하우스 룰이 적용된다는 점을 기억하세요.

The Carny
면책사항
해당 정보와 게시물은 금융, 투자, 트레이딩 또는 기타 유형의 조언이나 권장 사항으로 간주되지 않으며, 트레이딩뷰에서 제공하거나 보증하는 것이 아닙니다. 자세한 내용은 이용 약관을 참조하세요.
오픈 소스 스크립트
트레이딩뷰의 진정한 정신에 따라, 이 스크립트의 작성자는 이를 오픈소스로 공개하여 트레이더들이 기능을 검토하고 검증할 수 있도록 했습니다. 작성자에게 찬사를 보냅니다! 이 코드는 무료로 사용할 수 있지만, 코드를 재게시하는 경우 하우스 룰이 적용된다는 점을 기억하세요.
The Carny
면책사항
해당 정보와 게시물은 금융, 투자, 트레이딩 또는 기타 유형의 조언이나 권장 사항으로 간주되지 않으며, 트레이딩뷰에서 제공하거나 보증하는 것이 아닙니다. 자세한 내용은 이용 약관을 참조하세요.