OPEN-SOURCE SCRIPT
Adaptive Moving Average SD Bands [NJ]
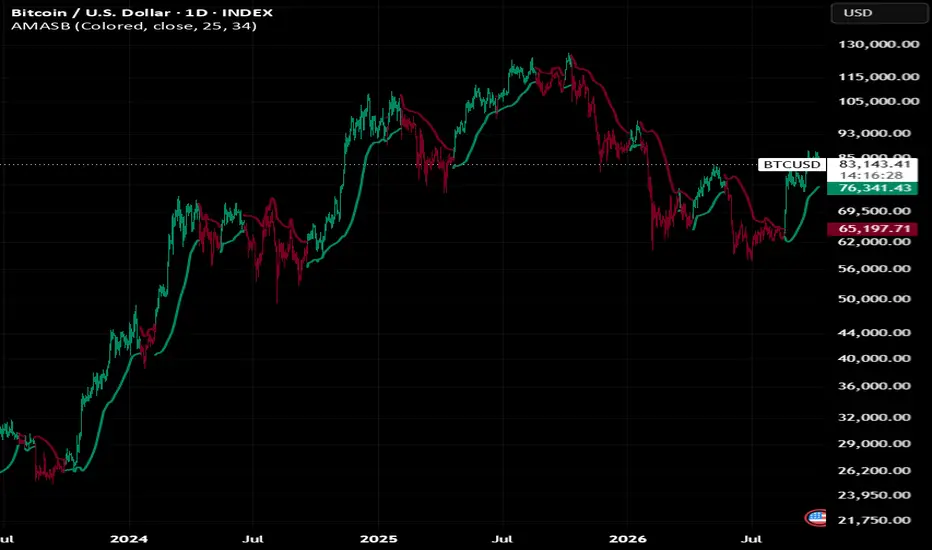
✧ OVERVIEW ✧
Adaptive Moving Average SD Bands is a volatility-based, trend-following indicator that builds standard deviation bands around three different moving averages and combines them into a single outer envelope.
RMA, SWMA and LSMA are calculated from the same source. Each moving average receives its own standard deviation bands, and the highest upper band and lowest lower band are used as the final bands.
Since the three moving averages react to price at different speeds, the envelope adapts its width to the distance between them, requiring a stronger move before the active condition changes.

✧ SETTINGS ✧
Color Mode
Switches between colored and neutral visualization.
Color Candles
Shows or hides candle coloring based on the current signal.
MA Source
Selects the price source used for the moving average calculations.
MA Length
Controls how many bars are used to calculate the RMA and LSMA.
SD Length
Controls how many bars are used to calculate the standard deviation.
✧ HOW IT WORKS ✧
Moving Averages
Indicator calculates three moving averages from selected source:
Wilder's Moving Average (RMA) applies exponential smoothing over MA Length and reacts slowly to new prices.
Symmetrically Weighted Moving Average (SWMA) uses a fixed four-bar window with the highest weights on the two middle bars, so it closely follows recent price.
Least Squares Moving Average (LSMA) fits a linear regression line over MA Length with a fixed offset of 1.
Standard Deviation Bands
Standard deviation of closing price is calculated over SD Length and measures how widely price has recently been dispersed.
Each moving average receives its own pair of bands:
Upper Band = Moving Average + Standard Deviation
Lower Band = Moving Average − Standard Deviation
Outer Envelope
Highest of the three upper bands is used as final upper band. Lowest of the three lower bands is used as final lower band.
When the moving averages spread apart, the envelope widens. When they converge, the envelope narrows toward a single pair of bands.
Signal Logic
A bullish condition is activated when the high of a candle moves above the final upper band.
A bearish condition is activated when the low of a candle moves below the final lower band.
If both happen on the same candle, the bearish condition takes priority.
Active condition remains unchanged until the opposite condition occurs.
✧ VISUALIZATION ✧
Green represents a bullish condition.
Red represents a bearish condition.
Neutral mode displays the same conditions using light and dark shades.
During a bullish condition, lower band is displayed in green.
During a bearish condition, upper band is displayed in red.
Same signal colors can optionally be applied directly to the chart candles.
✧ USAGE ✧
Adaptive Moving Average SD Bands can be used to identify:
Bullish and bearish trend conditions
Volatility-adjusted price breakouts
Dynamic trend support and resistance
Directional market bias
Trend confirmation
Additional confirmation for other technical analysis
Combining a slow, a fast and a regression-based moving average is designed to filter minor price moves that would cross bands built around a single moving average.
As with any technical indicator, it is best used alongside other forms of analysis rather than as a standalone entry or exit signal.
Adaptive Moving Average SD Bands is a volatility-based, trend-following indicator that builds standard deviation bands around three different moving averages and combines them into a single outer envelope.
RMA, SWMA and LSMA are calculated from the same source. Each moving average receives its own standard deviation bands, and the highest upper band and lowest lower band are used as the final bands.
Since the three moving averages react to price at different speeds, the envelope adapts its width to the distance between them, requiring a stronger move before the active condition changes.
✧ SETTINGS ✧
Color Mode
Switches between colored and neutral visualization.
Color Candles
Shows or hides candle coloring based on the current signal.
MA Source
Selects the price source used for the moving average calculations.
MA Length
Controls how many bars are used to calculate the RMA and LSMA.
SD Length
Controls how many bars are used to calculate the standard deviation.
✧ HOW IT WORKS ✧
Moving Averages
Indicator calculates three moving averages from selected source:
Wilder's Moving Average (RMA) applies exponential smoothing over MA Length and reacts slowly to new prices.
Symmetrically Weighted Moving Average (SWMA) uses a fixed four-bar window with the highest weights on the two middle bars, so it closely follows recent price.
Least Squares Moving Average (LSMA) fits a linear regression line over MA Length with a fixed offset of 1.
Standard Deviation Bands
Standard deviation of closing price is calculated over SD Length and measures how widely price has recently been dispersed.
Each moving average receives its own pair of bands:
Upper Band = Moving Average + Standard Deviation
Lower Band = Moving Average − Standard Deviation
Outer Envelope
Highest of the three upper bands is used as final upper band. Lowest of the three lower bands is used as final lower band.
When the moving averages spread apart, the envelope widens. When they converge, the envelope narrows toward a single pair of bands.
Signal Logic
A bullish condition is activated when the high of a candle moves above the final upper band.
A bearish condition is activated when the low of a candle moves below the final lower band.
If both happen on the same candle, the bearish condition takes priority.
Active condition remains unchanged until the opposite condition occurs.
✧ VISUALIZATION ✧
Green represents a bullish condition.
Red represents a bearish condition.
Neutral mode displays the same conditions using light and dark shades.
During a bullish condition, lower band is displayed in green.
During a bearish condition, upper band is displayed in red.
Same signal colors can optionally be applied directly to the chart candles.
✧ USAGE ✧
Adaptive Moving Average SD Bands can be used to identify:
Bullish and bearish trend conditions
Volatility-adjusted price breakouts
Dynamic trend support and resistance
Directional market bias
Trend confirmation
Additional confirmation for other technical analysis
Combining a slow, a fast and a regression-based moving average is designed to filter minor price moves that would cross bands built around a single moving average.
As with any technical indicator, it is best used alongside other forms of analysis rather than as a standalone entry or exit signal.
오픈 소스 스크립트
트레이딩뷰의 진정한 정신에 따라, 이 스크립트의 작성자는 이를 오픈소스로 공개하여 트레이더들이 기능을 검토하고 검증할 수 있도록 했습니다. 작성자에게 찬사를 보냅니다! 이 코드는 무료로 사용할 수 있지만, 코드를 재게시하는 경우 하우스 룰이 적용된다는 점을 기억하세요.

면책사항
해당 정보와 게시물은 금융, 투자, 트레이딩 또는 기타 유형의 조언이나 권장 사항으로 간주되지 않으며, 트레이딩뷰에서 제공하거나 보증하는 것이 아닙니다. 자세한 내용은 이용 약관을 참조하세요.
오픈 소스 스크립트
트레이딩뷰의 진정한 정신에 따라, 이 스크립트의 작성자는 이를 오픈소스로 공개하여 트레이더들이 기능을 검토하고 검증할 수 있도록 했습니다. 작성자에게 찬사를 보냅니다! 이 코드는 무료로 사용할 수 있지만, 코드를 재게시하는 경우 하우스 룰이 적용된다는 점을 기억하세요.
면책사항
해당 정보와 게시물은 금융, 투자, 트레이딩 또는 기타 유형의 조언이나 권장 사항으로 간주되지 않으며, 트레이딩뷰에서 제공하거나 보증하는 것이 아닙니다. 자세한 내용은 이용 약관을 참조하세요.