BTC On-Chain Value Zones [MVRV]
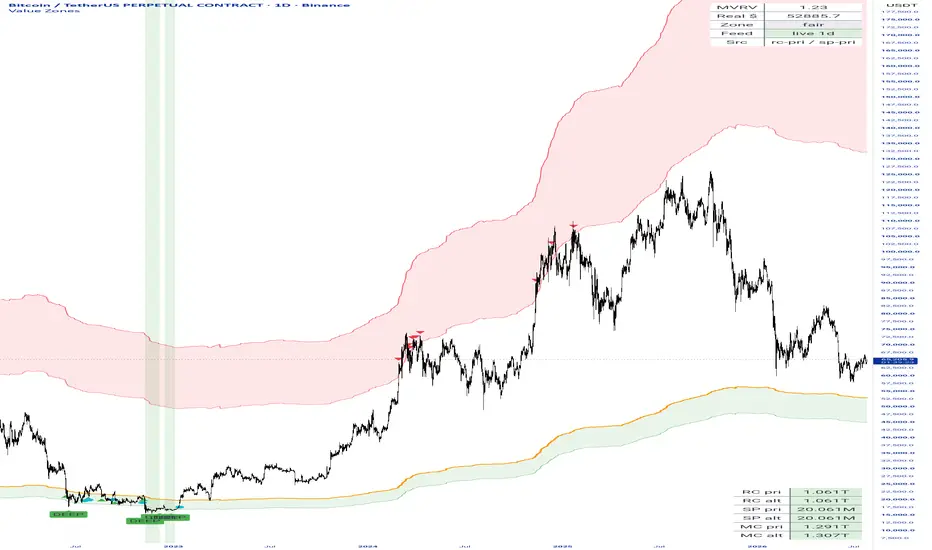
BTC Onchain Value Zones (MVRV)
Bitcoin has a cost basis. Realized Price is the average price at which every coin in circulation last moved onchain, which makes it a reasonable proxy for what the average holder actually paid. This script plots that level directly on your price chart and builds valuation zones around it.
MVRV is just price divided by Realized Price. When MVRV falls under 1, the average holder is sitting at a loss. Historically that condition has clustered around cycle lows and long accumulation ranges. When MVRV stretches well above 2.5, the market is carrying a large amount of unrealized profit, and historically that has clustered around distribution phases and cycle highs. It is a slow, structural read, not a trade trigger.
Why I rebuilt it
The common version of this idea relied on the IntoTheBlock MVRV feed. That feed stopped updating in August 2025 and TradingView flagged it as discontinued. Scripts using it did not throw an error. They quietly froze on a stale value and kept plotting a line that meant nothing, which is worse than breaking outright.
This version calculates MVRV itself from two live feeds:
Realized Price = Realized Cap / Circulating Supply
MVRV = Price / Realized Price
Realized Cap comes from CoinMetrics and Circulating Supply from Glassnode. If either symbol is unavailable on your plan, the script falls back to an alternate ticker automatically. If supply goes dark entirely, it derives supply from market cap divided by price so the realized line keeps working rather than vanishing.
The zones
Deep buy below 0.85, meaning capitulation territory where holders are heavily underwater.
Buy below 1.0, meaning price sits under the aggregate cost basis.
Fair value between 1.0 and 2.5.
Sell above 2.5.
Euphoria above 3.5.
Every threshold is adjustable in settings. The zones are drawn in price terms, not as an oscillator, so you can see exactly what dollar level each multiple sits at right now.
Signals
Markers fire when MVRV crosses a threshold on the daily close. Triangles mark entries into the buy and sell zones, labels mark deep value and euphoria, and a circle marks the moment price reclaims its cost basis, which has historically been a useful bottom confirmation. Alerts are available for each event individually, for any buy event, for any sell event, and for a stale data feed.
Diagnostics
Two tables. The top right shows current MVRV, realized price in dollars, the active zone, how many days old the onchain data is, and which feeds are supplying it. The bottom right lists all six candidate symbols with their current values, marked green if live and red if dead. If a data provider retires a ticker two years from now, you will see it immediately instead of trusting a frozen line.
How to use it
Onchain data updates once per day, so use this on a daily chart or higher. It is built for position sizing and accumulation decisions across weeks and months, not for entries. Treat the zones as context for whatever you are already doing.
One honest caveat. MVRV peaks have declined with every cycle as Bitcoin has matured and the holder base has grown. The 3.5 euphoria level was routine in 2013 and 2017 and has been harder to reach since. Adjust the upper thresholds to fit the market you are actually trading rather than assuming past extremes will repeat.
This is for informational purposes only and is not financial advice.
Bitcoin has a cost basis. Realized Price is the average price at which every coin in circulation last moved onchain, which makes it a reasonable proxy for what the average holder actually paid. This script plots that level directly on your price chart and builds valuation zones around it.
MVRV is just price divided by Realized Price. When MVRV falls under 1, the average holder is sitting at a loss. Historically that condition has clustered around cycle lows and long accumulation ranges. When MVRV stretches well above 2.5, the market is carrying a large amount of unrealized profit, and historically that has clustered around distribution phases and cycle highs. It is a slow, structural read, not a trade trigger.
Why I rebuilt it
The common version of this idea relied on the IntoTheBlock MVRV feed. That feed stopped updating in August 2025 and TradingView flagged it as discontinued. Scripts using it did not throw an error. They quietly froze on a stale value and kept plotting a line that meant nothing, which is worse than breaking outright.
This version calculates MVRV itself from two live feeds:
Realized Price = Realized Cap / Circulating Supply
MVRV = Price / Realized Price
Realized Cap comes from CoinMetrics and Circulating Supply from Glassnode. If either symbol is unavailable on your plan, the script falls back to an alternate ticker automatically. If supply goes dark entirely, it derives supply from market cap divided by price so the realized line keeps working rather than vanishing.
The zones
Deep buy below 0.85, meaning capitulation territory where holders are heavily underwater.
Buy below 1.0, meaning price sits under the aggregate cost basis.
Fair value between 1.0 and 2.5.
Sell above 2.5.
Euphoria above 3.5.
Every threshold is adjustable in settings. The zones are drawn in price terms, not as an oscillator, so you can see exactly what dollar level each multiple sits at right now.
Signals
Markers fire when MVRV crosses a threshold on the daily close. Triangles mark entries into the buy and sell zones, labels mark deep value and euphoria, and a circle marks the moment price reclaims its cost basis, which has historically been a useful bottom confirmation. Alerts are available for each event individually, for any buy event, for any sell event, and for a stale data feed.
Diagnostics
Two tables. The top right shows current MVRV, realized price in dollars, the active zone, how many days old the onchain data is, and which feeds are supplying it. The bottom right lists all six candidate symbols with their current values, marked green if live and red if dead. If a data provider retires a ticker two years from now, you will see it immediately instead of trusting a frozen line.
How to use it
Onchain data updates once per day, so use this on a daily chart or higher. It is built for position sizing and accumulation decisions across weeks and months, not for entries. Treat the zones as context for whatever you are already doing.
One honest caveat. MVRV peaks have declined with every cycle as Bitcoin has matured and the holder base has grown. The 3.5 euphoria level was routine in 2013 and 2017 and has been harder to reach since. Adjust the upper thresholds to fit the market you are actually trading rather than assuming past extremes will repeat.
This is for informational purposes only and is not financial advice.

Don't force a trade. Wait for your setup, be patient. Trade ideas are my own and not financial advice, I'm a monkey with a phone for crying out loud.
면책사항
해당 정보와 게시물은 금융, 투자, 트레이딩 또는 기타 유형의 조언이나 권장 사항으로 간주되지 않으며, 트레이딩뷰에서 제공하거나 보증하는 것이 아닙니다. 자세한 내용은 이용 약관을 참조하세요.
Don't force a trade. Wait for your setup, be patient. Trade ideas are my own and not financial advice, I'm a monkey with a phone for crying out loud.
면책사항
해당 정보와 게시물은 금융, 투자, 트레이딩 또는 기타 유형의 조언이나 권장 사항으로 간주되지 않으며, 트레이딩뷰에서 제공하거나 보증하는 것이 아닙니다. 자세한 내용은 이용 약관을 참조하세요.