OPEN-SOURCE SCRIPT
업데이트됨 BTC Aggregated Funding Rate
BTC Aggregated Funding Rate
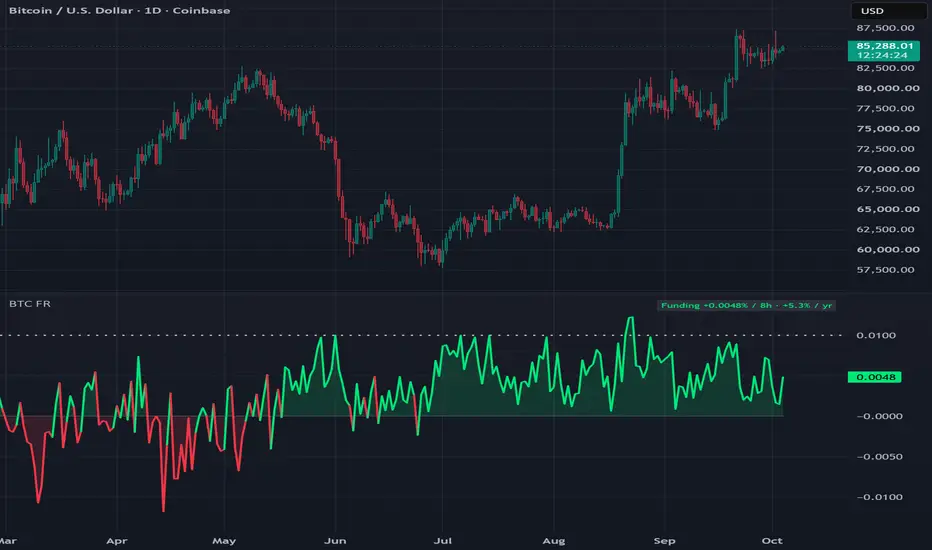
Funding across Binance, Bybit, OKX and Hyperliquid, put on a common basis and combined into one line — so you see what the whole perpetual market is paying, not one exchange.
WHAT IT SHOWS
- Funding line: green when positive (longs pay shorts), red when negative (shorts pay longs), shaded to zero.
- Neutral baseline (dotted): 0.01% per 8 hours (about 10.95% a year), the standard rate most exchanges settle at when neither side is crowded.
- Summary (top right): current funding per 8 hours and annualized.
WHAT MAKES IT DIFFERENT
- Common basis across exchanges. Hyperliquid pays funding every hour while the others pay every 8 hours. Averaging those raw rates together understates funding roughly eightfold; here every exchange is converted to a per-8-hour rate first.
- OI-weighted. Each exchange's funding is weighted by its open interest, so larger markets count for more. A simple average is available as an option.
- Unit detection. Funding data can arrive as a fraction (0.0001) or a percent (0.01); the script detects which and converts automatically, with a manual override.
HOW TO READ IT
- Near the baseline: balanced positioning.
- Well above the baseline: longs paying up to hold positions — leverage is leaning long.
- Below zero: shorts paying — leverage is leaning short.
- Funding describes how positioning leans, not when it will unwind. Crowded readings can persist for weeks in a strong trend. Read it alongside open interest and price structure rather than as a signal on its own.
SETTINGS
- Exchanges: toggle each one, change the symbol, set its OI unit (used for weighting) and its funding interval in hours.
- Show funding per 8 hours or annualized.
- OI-weighted or simple average.
- Optional smoothing, shading and baseline.
NOTES
- Funding data is retrieved with TradingView's open-source Request library (cryptoDerivativeMetric); open interest for weighting uses TradingView's "_OI" feeds.
- Values are taken at each bar's close; on the daily chart each point is that day's closing funding reading.
- Exchange histories start at different dates; early values may include fewer exchanges.
- This is an analysis tool, not financial advice or a trading signal.
Funding across Binance, Bybit, OKX and Hyperliquid, put on a common basis and combined into one line — so you see what the whole perpetual market is paying, not one exchange.
WHAT IT SHOWS
- Funding line: green when positive (longs pay shorts), red when negative (shorts pay longs), shaded to zero.
- Neutral baseline (dotted): 0.01% per 8 hours (about 10.95% a year), the standard rate most exchanges settle at when neither side is crowded.
- Summary (top right): current funding per 8 hours and annualized.
WHAT MAKES IT DIFFERENT
- Common basis across exchanges. Hyperliquid pays funding every hour while the others pay every 8 hours. Averaging those raw rates together understates funding roughly eightfold; here every exchange is converted to a per-8-hour rate first.
- OI-weighted. Each exchange's funding is weighted by its open interest, so larger markets count for more. A simple average is available as an option.
- Unit detection. Funding data can arrive as a fraction (0.0001) or a percent (0.01); the script detects which and converts automatically, with a manual override.
HOW TO READ IT
- Near the baseline: balanced positioning.
- Well above the baseline: longs paying up to hold positions — leverage is leaning long.
- Below zero: shorts paying — leverage is leaning short.
- Funding describes how positioning leans, not when it will unwind. Crowded readings can persist for weeks in a strong trend. Read it alongside open interest and price structure rather than as a signal on its own.
SETTINGS
- Exchanges: toggle each one, change the symbol, set its OI unit (used for weighting) and its funding interval in hours.
- Show funding per 8 hours or annualized.
- OI-weighted or simple average.
- Optional smoothing, shading and baseline.
NOTES
- Funding data is retrieved with TradingView's open-source Request library (cryptoDerivativeMetric); open interest for weighting uses TradingView's "_OI" feeds.
- Values are taken at each bar's close; on the daily chart each point is that day's closing funding reading.
- Exchange histories start at different dates; early values may include fewer exchanges.
- This is an analysis tool, not financial advice or a trading signal.
릴리즈 노트
Fixed a minor graphical detail릴리즈 노트
Minor background change릴리즈 노트
Minor: the neutral baseline (0.01% per 8h) is now a clearly dotted line, with style (dotted / dashed), color and width settings.오픈 소스 스크립트
트레이딩뷰의 진정한 정신에 따라, 이 스크립트의 작성자는 이를 오픈소스로 공개하여 트레이더들이 기능을 검토하고 검증할 수 있도록 했습니다. 작성자에게 찬사를 보냅니다! 이 코드는 무료로 사용할 수 있지만, 코드를 재게시하는 경우 하우스 룰이 적용된다는 점을 기억하세요.

면책사항
해당 정보와 게시물은 금융, 투자, 트레이딩 또는 기타 유형의 조언이나 권장 사항으로 간주되지 않으며, 트레이딩뷰에서 제공하거나 보증하는 것이 아닙니다. 자세한 내용은 이용 약관을 참조하세요.
오픈 소스 스크립트
트레이딩뷰의 진정한 정신에 따라, 이 스크립트의 작성자는 이를 오픈소스로 공개하여 트레이더들이 기능을 검토하고 검증할 수 있도록 했습니다. 작성자에게 찬사를 보냅니다! 이 코드는 무료로 사용할 수 있지만, 코드를 재게시하는 경우 하우스 룰이 적용된다는 점을 기억하세요.
면책사항
해당 정보와 게시물은 금융, 투자, 트레이딩 또는 기타 유형의 조언이나 권장 사항으로 간주되지 않으며, 트레이딩뷰에서 제공하거나 보증하는 것이 아닙니다. 자세한 내용은 이용 약관을 참조하세요.