OPEN-SOURCE SCRIPT
Bias Hunter v1.1
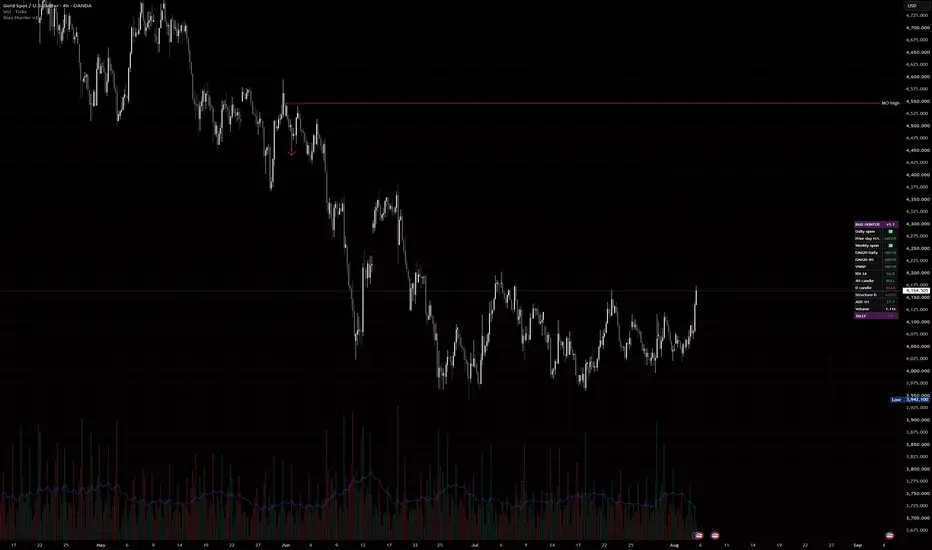
Bias Hunter v1.1 ... Pre-Session Bias Checklist Dashboard
Description:
Bias Hunter is a pre-session bias checklist for day traders. It condenses the routine "where are we?" questions you'd normally check by hand before a session into one dashboard, scores each factor +1 (bullish), -1 (bearish), or 0 (neutral), and shows a running tally.
It deliberately gives no LONG/SHORT verdict. The tally summarizes confluence; the trading decision stays yours.
WHAT IT CHECKS
Directional factors (each +1 / -1 / 0):
Daily open ... price above or below today's open
Prior day H/L ... above prior day high, inside the range, or below prior day low
Weekly open ... price above or below this week's open
EMA20 Daily ... price above or below the daily EMA
EMA20 4H ... price above or below the 4H EMA
VWAP ... price above or below session VWAP
RSI (regime-aware) ... in trending conditions (ADX ≥ 17) RSI above/below 50 reads as momentum. In choppy conditions it flips to mean-reversion mode and only votes at the extremes (below 30 bullish, above 70 bearish), marked "MR" on the dashboard
Prior 4H candle ... direction of the last completed 4H candle
Prior Daily candle ... direction of the last completed daily candle
Market structure ... HH/HL or LH/LL from the last confirmed pivots on Daily or 4H (selectable)
Context rows (shown but not counted in the tally):
ADX ... selectable timeframe (30m / 1H / 4H, default 1H for day trading). Green ≥ 25 (trending), yellow 17-25, white below, plus a CHOP flag under 15
Volume ... current bar volume vs its 20-bar average
TALLY
The bottom row sums all directional factors (range -10 to +10). Strong positive = broad bullish confluence, strong negative = broad bearish confluence, near zero = mixed conditions or chop.
Note: several factors are correlated by design (a strong trend day aligns most of them). A high tally means "everything agrees", not "high probability". Combine with your own entry framework.
NON-REPAINTING BY DESIGN
All higher-timeframe data pulled with lookahead off
EMAs, ADX, RSI regime, candles, and pivots use confirmed bars only
Factor states update on confirmed chart bars, so the tally does not flicker intrabar
Pivots confirm after the pivot length elapses ... structure is honest but reacts with a delay. That is the price of no repaint
SETTINGS
Structure timeframe (D or 4H) and pivot length
EMA, RSI, ADX, volume-average lengths
ADX timeframe (30m / 1H / 4H)
Dashboard position and text size
Works on any symbol and any chart timeframe ... built and tested on gold, indices, and crypto.
Part of the Hunters Trades indicator suite. Feedback welcome.
오픈 소스 스크립트
트레이딩뷰의 진정한 정신에 따라, 이 스크립트의 작성자는 이를 오픈소스로 공개하여 트레이더들이 기능을 검토하고 검증할 수 있도록 했습니다. 작성자에게 찬사를 보냅니다! 이 코드는 무료로 사용할 수 있지만, 코드를 재게시하는 경우 하우스 룰이 적용된다는 점을 기억하세요.

면책사항
해당 정보와 게시물은 금융, 투자, 트레이딩 또는 기타 유형의 조언이나 권장 사항으로 간주되지 않으며, 트레이딩뷰에서 제공하거나 보증하는 것이 아닙니다. 자세한 내용은 이용 약관을 참조하세요.
오픈 소스 스크립트
트레이딩뷰의 진정한 정신에 따라, 이 스크립트의 작성자는 이를 오픈소스로 공개하여 트레이더들이 기능을 검토하고 검증할 수 있도록 했습니다. 작성자에게 찬사를 보냅니다! 이 코드는 무료로 사용할 수 있지만, 코드를 재게시하는 경우 하우스 룰이 적용된다는 점을 기억하세요.
면책사항
해당 정보와 게시물은 금융, 투자, 트레이딩 또는 기타 유형의 조언이나 권장 사항으로 간주되지 않으며, 트레이딩뷰에서 제공하거나 보증하는 것이 아닙니다. 자세한 내용은 이용 약관을 참조하세요.