OPEN-SOURCE SCRIPT
BTC Halving Indicator
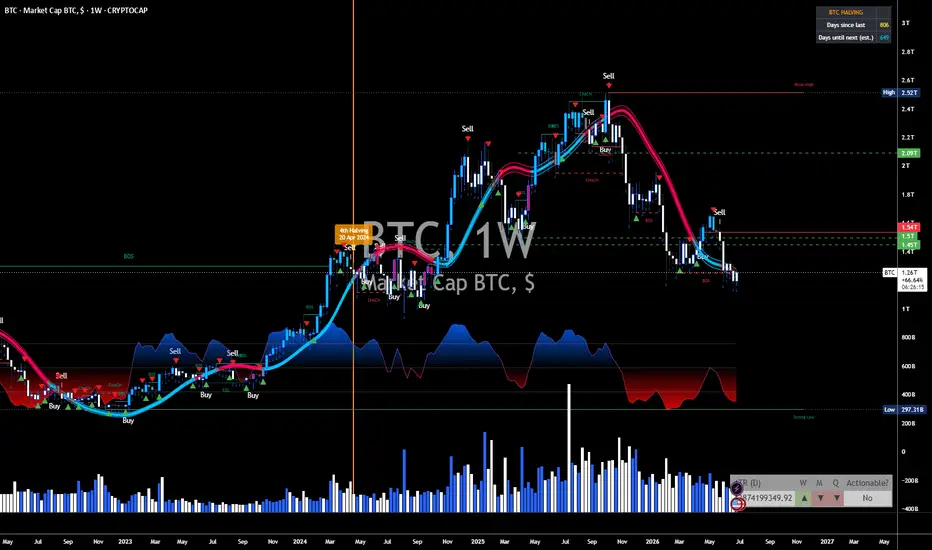
**What it does:**
- Draws an **orange vertical line + label** at each past halving: 28 Nov 2012, 9 Jul 2016, 11 May 2020, and 20 Apr 2024
- Draws a **dashed aqua line** at the estimated 5th halving (~April 2028) when it's close enough to appear on your chart
- Shows a **live counter table** in the top-right: days since the last halving and estimated days until the next one
- Has settings to change colors and toggle the labels/counter on or off
**How to install it in TradingView:**
1. Open a BTC chart (e.g. BTCUSD) on tradingview.com
2. Click **Pine Editor** at the bottom of the screen
3. Delete whatever's in the editor, paste in the full contents of the file
4. Click **Save**, then **Add to chart**
Two tips: use the **daily or weekly timeframe** — on low timeframes like 5m, TradingView doesn't load history back to 2012, so the older halving lines won't appear. And note the 2028 date is an estimate; the actual halving happens at block 1,050,000, so the real date drifts slightly with block times.
Want me to add anything, like cycle-phase background shading or price-at-halving markers?
오픈 소스 스크립트
트레이딩뷰의 진정한 정신에 따라, 이 스크립트의 작성자는 이를 오픈소스로 공개하여 트레이더들이 기능을 검토하고 검증할 수 있도록 했습니다. 작성자에게 찬사를 보냅니다! 이 코드는 무료로 사용할 수 있지만, 코드를 재게시하는 경우 하우스 룰이 적용된다는 점을 기억하세요.

면책사항
해당 정보와 게시물은 금융, 투자, 트레이딩 또는 기타 유형의 조언이나 권장 사항으로 간주되지 않으며, 트레이딩뷰에서 제공하거나 보증하는 것이 아닙니다. 자세한 내용은 이용 약관을 참조하세요.
오픈 소스 스크립트
트레이딩뷰의 진정한 정신에 따라, 이 스크립트의 작성자는 이를 오픈소스로 공개하여 트레이더들이 기능을 검토하고 검증할 수 있도록 했습니다. 작성자에게 찬사를 보냅니다! 이 코드는 무료로 사용할 수 있지만, 코드를 재게시하는 경우 하우스 룰이 적용된다는 점을 기억하세요.
면책사항
해당 정보와 게시물은 금융, 투자, 트레이딩 또는 기타 유형의 조언이나 권장 사항으로 간주되지 않으며, 트레이딩뷰에서 제공하거나 보증하는 것이 아닙니다. 자세한 내용은 이용 약관을 참조하세요.