업데이트됨
[blackcat] L1 Mel Widner Auto Support and Resistance
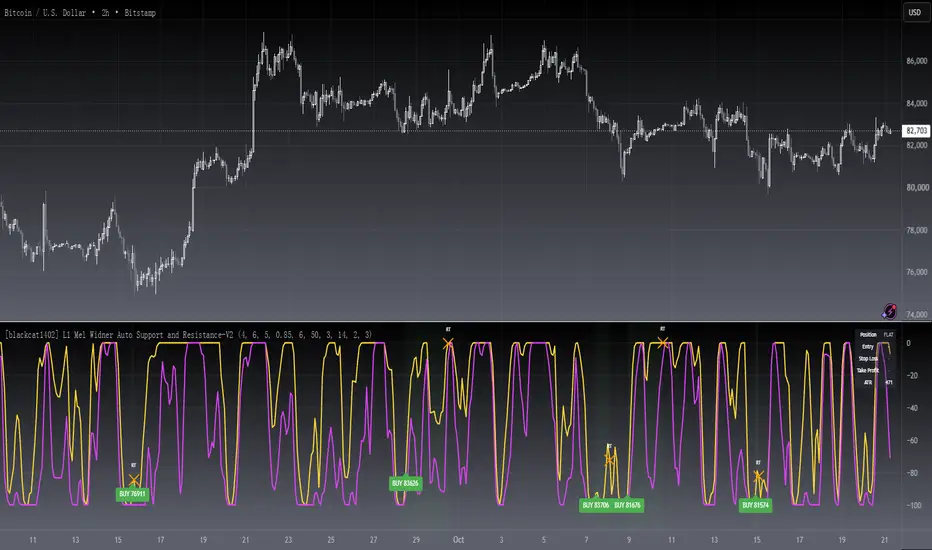
Level: 1
Background
This indicator/formula was presented in the May 1998 issue of the ‘Technical Analysis of Stocks and Commodities’ magazine. The article was titled “Automatic support and resistance” the article described an approach to finding support and resistance levels on a chart.
Function
Support and resistance analysis is a proven method for selecting key price levels for trading decisions; traders usually perform the analysis by hand. The automatic charting method and new oscillators presented here are easy to implement and give a precise comparison of price to these important levels. Suppose prices are moving higher, fed by steady cash flow and favorable expectations. Then, at some point, the advance begins to slow. Upward momentum is still dominant, but at that point it is diminishing and the rate of rise is decreasing, evidence of resistance. It is like throwing a ball into the air; the ball starts with initial momentum, then slows under the influence of gravity before eventually falling.
Prices behave in a similar manner. After opposing resistance forces are applied for a time, prices slow, finally stop, and reverse direction. The turning point is a resistance level and is the highest high price for that particular period. The converse is true for declining prices. A slowing decline results from support forces and a support level is established at the point where prices turn upward.
Simply, forces cause acceleration. Market forces do not directly produce momentum, but rather momentum changes. These momentum changes in turn are integrated or accumulated to establish momentum. The presence of market forces is evident when the slope of prices, or momentum, changes over time. The effect is most dramatic when forces also change, triggered by price moves or changes in expectations, and abrupt reversals occur. Examination of price histories can confirm the presence of these features.
Two oscillators are defined: the WSO (Widner support oscillator) and the WRO (Widner resistance oscillator). The WSO compares the current close with the most recent six support levels. Values range from zero to 100. WSO = zero means that the close is below all of the six support levels, and
WSO = 100 means that the current close is above all of the six support levels. Changes in WSO indicate changes in support, either breaking of an old level or establishing a new one. The WSO abd WRO are defined as:
WSO = 100( 1 – (INT(S1/C) + INT(S2/C) + INT(S3/C) + INT(S4/C) + INT(S5/C) + INT(S6/C)) / 6)
WRO = 100( 1 – (INT(R1/C) + INT(R2/C) + INT(R3/C) + INT(R4/C) + INT(R5/C) + INT(R6/C)) / 6)
Consequently, WSO and WRO can cross, but this is very uncommon.
Enter long when support is strong and resistance is weak or enter when support is building.
Key Signal
wso --> Widner support oscillator.
wro --> Widner resistance oscillator.
Remarks
This is a Level 1 free and open source indicator.
Feedbacks are appreciated.
Background
This indicator/formula was presented in the May 1998 issue of the ‘Technical Analysis of Stocks and Commodities’ magazine. The article was titled “Automatic support and resistance” the article described an approach to finding support and resistance levels on a chart.
Function
Support and resistance analysis is a proven method for selecting key price levels for trading decisions; traders usually perform the analysis by hand. The automatic charting method and new oscillators presented here are easy to implement and give a precise comparison of price to these important levels. Suppose prices are moving higher, fed by steady cash flow and favorable expectations. Then, at some point, the advance begins to slow. Upward momentum is still dominant, but at that point it is diminishing and the rate of rise is decreasing, evidence of resistance. It is like throwing a ball into the air; the ball starts with initial momentum, then slows under the influence of gravity before eventually falling.
Prices behave in a similar manner. After opposing resistance forces are applied for a time, prices slow, finally stop, and reverse direction. The turning point is a resistance level and is the highest high price for that particular period. The converse is true for declining prices. A slowing decline results from support forces and a support level is established at the point where prices turn upward.
Simply, forces cause acceleration. Market forces do not directly produce momentum, but rather momentum changes. These momentum changes in turn are integrated or accumulated to establish momentum. The presence of market forces is evident when the slope of prices, or momentum, changes over time. The effect is most dramatic when forces also change, triggered by price moves or changes in expectations, and abrupt reversals occur. Examination of price histories can confirm the presence of these features.
Two oscillators are defined: the WSO (Widner support oscillator) and the WRO (Widner resistance oscillator). The WSO compares the current close with the most recent six support levels. Values range from zero to 100. WSO = zero means that the close is below all of the six support levels, and
WSO = 100 means that the current close is above all of the six support levels. Changes in WSO indicate changes in support, either breaking of an old level or establishing a new one. The WSO abd WRO are defined as:
WSO = 100( 1 – (INT(S1/C) + INT(S2/C) + INT(S3/C) + INT(S4/C) + INT(S5/C) + INT(S6/C)) / 6)
WRO = 100( 1 – (INT(R1/C) + INT(R2/C) + INT(R3/C) + INT(R4/C) + INT(R5/C) + INT(R6/C)) / 6)
Consequently, WSO and WRO can cross, but this is very uncommon.
Enter long when support is strong and resistance is weak or enter when support is building.
Key Signal
wso --> Widner support oscillator.
wro --> Widner resistance oscillator.
Remarks
This is a Level 1 free and open source indicator.
Feedbacks are appreciated.
릴리즈 노트
OVERVIEWThis script implements an advanced L1 Mel Widner algorithm for automatically identifying support and resistance levels in financial markets. It utilizes customizable oscillators to detect potential trading opportunities and generates real-time buy/sell signals based on crossover patterns. The indicator is designed to work across various timeframes and asset classes, providing traders with actionable insights for their trading strategies.
FEATURES
• Dual Oscillator System: Combines support and resistance oscillators for comprehensive market analysis
• Customizable Parameters: Adjustable strength, length, and average length inputs for optimal performance
• Smoothed Indicators: Uses ALMA (Arnaud Legoux Moving Average) for reduced noise and clearer signals
• Visual Alerts: Real-time BUY/SELL labels displayed directly on the chart
• Alert Notifications: Built-in alert conditions for automated signal notifications
HOW TO USE
Parameter Configuration:
Adjust Strength to control sensitivity to price movements
Modify Length to influence the lookback period
Fine-tune Average Length for smoother oscillator readings
Signal Interpretation:
BUY signals appear when support oscillator crosses above resistance oscillator
SELL signals trigger when resistance oscillator crosses below support oscillator
Signals are only generated when oscillator values exceed -50 threshold
Integration:
Overlay with other technical indicators for enhanced analysis
Utilize alert conditions for automated trading systems
LIMITATIONS
• May produce false signals during high volatility periods
• Best suited for trending markets rather than ranging conditions
• Requires proper parameter tuning for specific market conditions
NOTES
• Developed by blackcat1402
• Based on the Mozilla Public License 2.0
• Compatible with TradingView's Pine Script v5
릴리즈 노트
█ OVERVIEWThis open-source indicator rebuilds Mel Widner's automatic support and resistance study as two smoothed oscillators and turns their crossovers into a complete long/short system with ATR-based risk management. Green BUY and red SELL labels mark entries, while orange crosses mark signal and risk exits.
█ CONCEPTS
The script extends the classic Widner study with a full trading framework:
• Automatic S/R pockets: rolling pools of past swing lows and swing highs are condensed into a Support Oscillator (yellow) and a Resistance Oscillator (fuchsia)
• ALMA smoothing: both oscillators pass through an Arnaud Legoux Moving Average to reduce noise
• Threshold gating: long entries require the Support Oscillator to cross up from deeper than a configurable level (default -50); shorts mirror it above +50
• Position state machine: entries, exits, and same-bar flips are arbitrated so signals never contradict the current position
• ATR risk envelope: every entry receives a volatility-adaptive stop loss and take profit reference
█ HOW TO USE
1 — Add the indicator to any chart; it opens in its own pane below price.
2 — Tune the Oscillator group (Strength, Length, Average Length) for your market.
3 — Read BUY when the yellow line crosses above the fuchsia line from deep negative territory; read SELL on the mirrored event.
4 — Track Entry, Stop Loss, and Take Profit in the Data Window or the dashboard table.
5 — Create alerts from TradingView's alert menu; each signal type has its own channel.
Input Groups
• Oscillator: Strength (4), Length (6), Average Length (5), ALMA Offset (0.85), ALMA Sigma (6)
• Signal: Threshold (50), Cooldown Bars (3, set 0 to disable)
• Risk: ATR Length (14), Stop Loss xATR (2.0), Take Profit xATR (3.0), Data Window display, exit on touch
• Visual: position background, dashboard
█ FEATURES
• Dual oscillator plot with entry labels that include the fill price
• State-machine signal governance with a configurable cooldown between entries
• ATR-based stop loss and take profit levels (entry minus/plus multiple x ATR)
• Optional automatic exit when the stop or target is touched
• Position background tinting and a status dashboard (Position, Entry, SL, TP, ATR)
• Five alertcondition channels plus dynamic alerts carrying the price, all confirmed on bar close
█ SIGNALS
Visual Elements
• BUY label (green): support oscillator crossed up while deeply oversold
• SELL label (red): resistance oscillator crossed down while deeply overbought
• XL / XS cross (orange): exit long / exit short on the opposite signal
• RT cross (orange): risk exit after the stop loss or take profit is touched
• Background tint: green = long position, red = short position
• Dashboard (top right): live position, entry, stop, target, and ATR
█ IMPLEMENTATION NOTES
• Written in Pine Script v6; the core arrays follow the original Widner bucket method, smoothed via ta.alma, triggered via ta.crossover/ta.crossunder, and sized via ta.atr
• All alert() calls use alert.freq_once_per_bar_close; no request.security is used, so there is no higher-timeframe repainting
• Entry/SL/TP values are routed to the Data Window to preserve the pane's oscillator scaling
• Exit-on-touch is evaluated from the bar after entry to avoid same-bar false triggers
█ LIMITATIONS
• Prone to whipsaw in sideways markets; raise Threshold or Cooldown Bars to filter noise
• Defaults were tuned on daily crypto and forex charts; re-tune per market and timeframe
• Exits rely on bar-close signals and intrabar touch detection; real fills may differ through gaps or slippage
• This is an educational tool, not financial advice
█ NOTES
• Based on Mel Widner's "Automatic Support and Resistance" concept
• Mozilla Public License 2.0 — free to use and modify with attribution
• For questions or feedback, use the comments section below
═════════════════════════════════════════════════════════════════════════

Don't miss out! The first and most important thing to do is to join my Discord chat now! Click here to start your adventure: discord.com/invite/ZTGpQJq My new github for more pine development soon: github.com/wxt-coder
면책사항
해당 정보와 게시물은 금융, 투자, 트레이딩 또는 기타 유형의 조언이나 권장 사항으로 간주되지 않으며, 트레이딩뷰에서 제공하거나 보증하는 것이 아닙니다. 자세한 내용은 이용 약관을 참조하세요.
Don't miss out! The first and most important thing to do is to join my Discord chat now! Click here to start your adventure: discord.com/invite/ZTGpQJq My new github for more pine development soon: github.com/wxt-coder
면책사항
해당 정보와 게시물은 금융, 투자, 트레이딩 또는 기타 유형의 조언이나 권장 사항으로 간주되지 않으며, 트레이딩뷰에서 제공하거나 보증하는 것이 아닙니다. 자세한 내용은 이용 약관을 참조하세요.