OPEN-SOURCE SCRIPT
GFG Candle Countdown MM:SS by Agaam
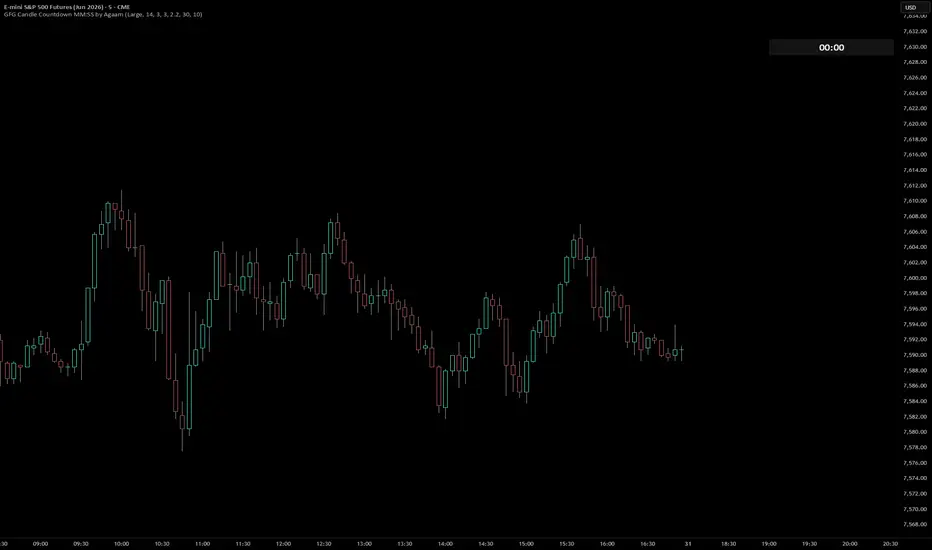
## GFG Candle Countdown MM:SS
**GFG Candle Countdown MM:SS** is a clean chart utility that displays the remaining time of the current candle in a simple **minutes:seconds** format.
The purpose of this script is to help traders quickly see how much time is left before the current candle closes without adding extra labels, signals, arrows, or unnecessary chart clutter. The countdown is displayed in a table on the top-right side of the chart and can be moved lower using the vertical offset settings.
## What This Indicator Does
This indicator calculates the time remaining until the current candle closes by comparing the candle close time with the current real-time clock. The result is shown as a simple countdown in this format:
**MM:SS**
For example:
**02:45**
means there are 2 minutes and 45 seconds left before the current candle closes.
## Why This Script Is Useful
Many traders make decisions near candle close, especially when waiting for confirmation from the current bar. This countdown helps traders see the remaining candle time clearly without needing to look away from the chart.
It can be useful for:
* Waiting for candle close confirmation
* Managing entries near the end of a bar
* Avoiding rushed decisions before a candle finishes
* Monitoring short timeframes during active trading
* Keeping the chart clean while still showing important timing information
## Clean Chart Design
This script is intentionally simple. It does not print candle labels, buy signals, sell signals, trend signals, or extra text. It only shows the countdown timer.
The visual design is meant to stay clean and easy to read:
* Right-side table display
* Only MM:SS text
* Adjustable size
* Adjustable cell width and height
* Adjustable vertical position
* Custom background color
* Custom number color
## Warning Color Option
The indicator includes optional warning colors for traders who want the countdown to change color as the candle gets close to closing.
Users can set:
* Warning color
* Danger color
* Warning seconds
* Danger seconds
For example, the countdown can turn yellow when less than 30 seconds remain and red when less than 10 seconds remain.
This feature is optional and can be turned off for a simple one-color countdown.
## Customization
Users can customize:
* Show or hide the countdown
* Countdown text size
* Table cell width
* Table cell height
* Vertical offset position
* Background color
* Countdown number color
* Warning and danger colors
* Warning and danger timing thresholds
These options allow traders to place the countdown where it fits best on their chart layout.
## Important Notes
This script is a timing utility only. It does not predict price direction, generate trade signals, or provide buy/sell recommendations.
The countdown works on time-based charts where candle close time is available. On chart types where candle close time is not available, the script may display **N/A**.
## Disclaimer
This indicator is for educational and informational purposes only. It is not financial advice and does not guarantee trading results. Trading involves risk, and every trader is responsible for their own decisions.
오픈 소스 스크립트
트레이딩뷰의 진정한 정신에 따라, 이 스크립트의 작성자는 이를 오픈소스로 공개하여 트레이더들이 기능을 검토하고 검증할 수 있도록 했습니다. 작성자에게 찬사를 보냅니다! 이 코드는 무료로 사용할 수 있지만, 코드를 재게시하는 경우 하우스 룰이 적용된다는 점을 기억하세요.

면책사항
해당 정보와 게시물은 금융, 투자, 트레이딩 또는 기타 유형의 조언이나 권장 사항으로 간주되지 않으며, 트레이딩뷰에서 제공하거나 보증하는 것이 아닙니다. 자세한 내용은 이용 약관을 참조하세요.
오픈 소스 스크립트
트레이딩뷰의 진정한 정신에 따라, 이 스크립트의 작성자는 이를 오픈소스로 공개하여 트레이더들이 기능을 검토하고 검증할 수 있도록 했습니다. 작성자에게 찬사를 보냅니다! 이 코드는 무료로 사용할 수 있지만, 코드를 재게시하는 경우 하우스 룰이 적용된다는 점을 기억하세요.
면책사항
해당 정보와 게시물은 금융, 투자, 트레이딩 또는 기타 유형의 조언이나 권장 사항으로 간주되지 않으며, 트레이딩뷰에서 제공하거나 보증하는 것이 아닙니다. 자세한 내용은 이용 약관을 참조하세요.