Order Block Holding Power [AlgoNorth]
Order Block Holding Power
An order block that formed five bars ago and one that has survived two hundred are not the same level, yet most charts draw them exactly alike. Order Block Holding Power treats every order block on your chart as a clock that started the moment it formed, and measures how long blocks on this market and timeframe actually last before price closes through them.
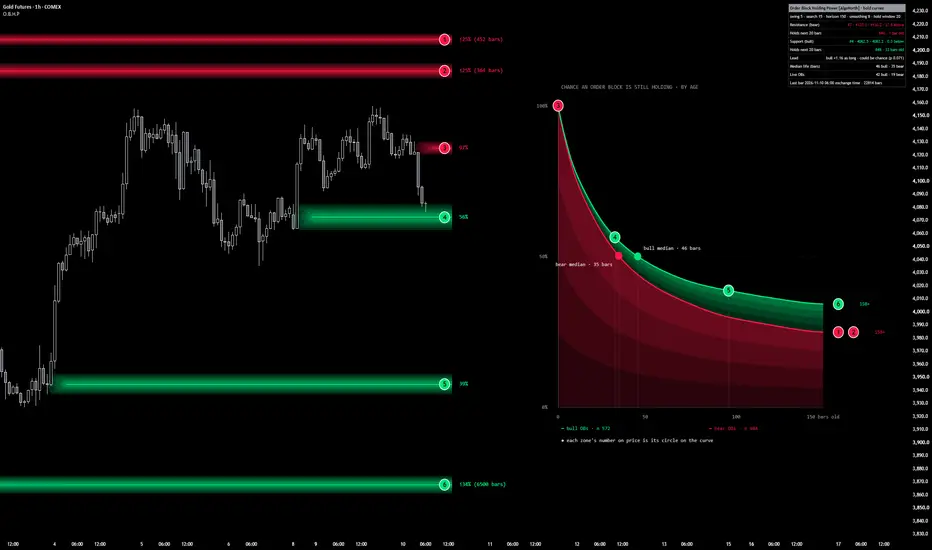
The live order blocks nearest to price are drawn on the chart, each with a numbered circle and the share of past blocks that held as long as it has. Beside the last bar, two hold curves, one for bull blocks and one for bear blocks, show the chance a block is still holding at every age. Each zone's number sits on its curve at its own age, so you can see at a glance whether a level is young and untested or one of the rare survivors.
The curves are built with the Kaplan–Meier estimator, published by Edward L. Kaplan and Paul Meier, which allows blocks that are still alive to count without pretending to know when they will break. A panel gives the odds that the nearest block above and below price holds for a number of bars you choose, and reports which side's blocks are lasting longer and whether that gap could be chance.
🔶 USAGE
🔸 Zones on price
The nearest live bull and bear order blocks are drawn from their order block candle to just past the last bar. Each carries a numbered circle and a percentage: the share of all blocks on that side that have reached this zone's age. It describes blocks of that age as a group, not the odds for this one zone. A zone older than the curve shows "≤" with the curve's end value and its age in bars, because no more blocks can reach its age than reach the end of the curve. When zones sit close together in price, their labels stack and each is tagged with its zone number so you can tell them apart.
🔸 Hold curves
To the right of price, the green curve is bull blocks and the red curve is bear blocks. Both start at 100% and fall as blocks break with age. The vertical scale runs from 100% to 0%, the horizontal scale is age in bars up to the curve horizon, and the legend shows how many blocks each curve is built from. The side that holds for less time is shaded from its curve down to 0%, so the large shaded area belongs to the trailing side. The band above it, in the other colour, is the extra life the leading side holds over it. A dot and label mark each side's median life, the age by which half of its blocks have broken.
🔸 Linking zones to the curve
Every numbered circle on price has a matching circle on its side's curve, placed at that zone's age. A circle high on the curve is a young block that most blocks outlast. A circle far down the curve is a block that has already outlived most of its peers. Zones older than the curve are parked in a row just past its end, one row per side.
🔸 Reading a level
A high percentage on a zone means it is young: most blocks get that far, so its age says little about it yet. A low percentage means the zone has already outlasted most blocks on its side. The curve does not decide whether that makes the level stronger or closer to its end. For that, read the "Holds next" rows in the panel, which give the measured odds from that age onward.
🔸 Panel
The Resistance and Support rows show the nearest bear block above price and bull block below it, with their zone number, range and distance. Each is followed by the odds that block holds for the next number of bars set in Hold window, given how long it has already held. If the block has outlived the curve, or the window would run past the horizon, the row says so instead of giving a figure.
🔸 The Lead row names the side whose blocks hold longer, by how much, and whether the gap could be chance, for example "bull ×1.16 as long · could be chance (p 0.071)". The remaining rows give each side's median life in bars, the number of live blocks on each side, and the time and count of the last bar. The line under the title lists the settings in use, so a screenshot always carries its own context.
🔶 DETAILS
🔸 A swing high or low is confirmed once it has the set number of bars on each side. A close beyond a confirmed swing is a structure break, and the last opposite candle before that break becomes the order block, using that candle's full high-to-low range.
🔸 A bull block breaks when a bar closes below its bottom, and a bear block breaks when a bar closes above its top. Wicks through a block do not break it.
🔸 Each block's age is counted in closed bars from the structure break that created it, not from the order block candle, so the drawn zone starts a few bars before age zero. Blocks that are still alive are included in the curves as "held at least this long", which is what the Kaplan–Meier method is designed for. Leaving them out would make blocks look shorter-lived than they are.
🔸 The drawn curves are a smoothed form of the raw hold rate. The smoothing narrows near age zero, where blocks break fastest, so the percentages, medians and odds stay close to the raw figures.
🔸 The lead is measured as the average number of bars each side holds within the curve horizon, and the panel shows it as a multiple: ×1.16 means the leading side's blocks hold 1.16 times as long. The test behind the p value groups blocks that lived through the same stretch of price together, since they are not independent of one another. Below a p value of 0.05 the gap is read as unlikely to be chance, and the Lead row and title bar take the leading side's colour.
🔸 The lead is not tested or shaded until each side has at least five breaks inside the horizon. A median shown as greater than the horizon means that side's curve has not fallen to 50% within it.
🔸 The optional confidence band is a 95% band around the leading side's curve, widened for the same grouping.
🔸 Text colours adjust to light and dark chart backgrounds, and fall back to the chart's own text colour where the bull and bear colours would be hard to read.
🔶 SETTINGS
🔸 Order blocks: swing length, how far back to search for the order block candle, and how many zones to show per side.
🔸 Hold curves: curve horizon, curve width, space before the curve, curve smoothing, the confidence band, and linking zones to the curve.
🔸 Panel: on or off, position, text size, and the hold window used for the "Holds next" rows.
🔶 NOTES
🔸 This is a context tool. The percentages, medians and odds are counts of what past order blocks on this chart did. They are not predictions, and nothing here tells you to buy or sell. A Lead row showing one side ahead is a statement about how long levels have lasted, not a trade direction. Use it alongside your own analysis and risk management.
🔸 Blocks form and break only on bar close. A zone appears on the close of the bar that breaks structure, with its start placed back on the order block candle, so it is always drawn at least one bar after that candle and at least Swing length + 1 bars after the swing it broke. Once a bar has closed, every block's range, age, percentage, both curves, both medians and the p value are fixed.
🔸 A few things move while a bar is still open, because they read the live price: which block the panel calls nearest, its distance, and whether price is above, below or inside it. If price pokes through a zone mid-bar, the zone stays until the close decides.
🔸 The curve chart is drawn to the right of the last bar and needs room there. Set your chart's right margin to roughly 115 bars at the default settings, a little more when old zones are parked past the curve, or reduce Curve width and Space before curve.
🔸 On most charts bull and bear blocks last about as long as each other, and the Lead row will say the gap could be chance. That is a normal result, not a fault. The nearest-level rows and the zone percentages are the part that changes as price moves.
🔸 The lead belongs to the curve horizon. The multiple and the p value are measured only up to that age, so a different horizon can give a different read on the same chart. Results also differ between timeframes on the same symbol.
🔸 Everything is measured from the bars loaded on your chart. More history gives the curves more blocks to work with, and a chart with little history will show wider swings in the figures.
🔸 Hold window is counted in bars, so on daily and weekly charts the default covers a long stretch of time. Lower it there if you want a nearer read.
🔸 Not every break of a swing makes a zone. A swing must be confirmed before it can be broken, and each swing is used once.
🔸 Up to 60 live blocks are tracked per side. The oldest beyond that stop being tracked and count as having held to that age.
🔸 On short histories the Lead row reads "collecting" until each side has enough breaks inside the horizon, and the lead is not shaded until then.
🔸 Scrolling or zooming redraws the layout, such as where the circles sit and where an old zone starts on the left. It does not change any price, age, percentage or panel number.
🔸 Built for standard candle charts.
🔶 SUMMARY
Order Block Holding Power measures how long order blocks last on your chart. The nearest live blocks are drawn on price with the share of past blocks that held as long as they have, two hold curves show the chance a bull or bear block is still holding at every age, and the panel gives the odds the nearest levels hold from here and which side's blocks are lasting longer.
An order block that formed five bars ago and one that has survived two hundred are not the same level, yet most charts draw them exactly alike. Order Block Holding Power treats every order block on your chart as a clock that started the moment it formed, and measures how long blocks on this market and timeframe actually last before price closes through them.
The live order blocks nearest to price are drawn on the chart, each with a numbered circle and the share of past blocks that held as long as it has. Beside the last bar, two hold curves, one for bull blocks and one for bear blocks, show the chance a block is still holding at every age. Each zone's number sits on its curve at its own age, so you can see at a glance whether a level is young and untested or one of the rare survivors.
The curves are built with the Kaplan–Meier estimator, published by Edward L. Kaplan and Paul Meier, which allows blocks that are still alive to count without pretending to know when they will break. A panel gives the odds that the nearest block above and below price holds for a number of bars you choose, and reports which side's blocks are lasting longer and whether that gap could be chance.
🔶 USAGE
🔸 Zones on price
The nearest live bull and bear order blocks are drawn from their order block candle to just past the last bar. Each carries a numbered circle and a percentage: the share of all blocks on that side that have reached this zone's age. It describes blocks of that age as a group, not the odds for this one zone. A zone older than the curve shows "≤" with the curve's end value and its age in bars, because no more blocks can reach its age than reach the end of the curve. When zones sit close together in price, their labels stack and each is tagged with its zone number so you can tell them apart.
🔸 Hold curves
To the right of price, the green curve is bull blocks and the red curve is bear blocks. Both start at 100% and fall as blocks break with age. The vertical scale runs from 100% to 0%, the horizontal scale is age in bars up to the curve horizon, and the legend shows how many blocks each curve is built from. The side that holds for less time is shaded from its curve down to 0%, so the large shaded area belongs to the trailing side. The band above it, in the other colour, is the extra life the leading side holds over it. A dot and label mark each side's median life, the age by which half of its blocks have broken.
🔸 Linking zones to the curve
Every numbered circle on price has a matching circle on its side's curve, placed at that zone's age. A circle high on the curve is a young block that most blocks outlast. A circle far down the curve is a block that has already outlived most of its peers. Zones older than the curve are parked in a row just past its end, one row per side.
🔸 Reading a level
A high percentage on a zone means it is young: most blocks get that far, so its age says little about it yet. A low percentage means the zone has already outlasted most blocks on its side. The curve does not decide whether that makes the level stronger or closer to its end. For that, read the "Holds next" rows in the panel, which give the measured odds from that age onward.
🔸 Panel
The Resistance and Support rows show the nearest bear block above price and bull block below it, with their zone number, range and distance. Each is followed by the odds that block holds for the next number of bars set in Hold window, given how long it has already held. If the block has outlived the curve, or the window would run past the horizon, the row says so instead of giving a figure.
🔸 The Lead row names the side whose blocks hold longer, by how much, and whether the gap could be chance, for example "bull ×1.16 as long · could be chance (p 0.071)". The remaining rows give each side's median life in bars, the number of live blocks on each side, and the time and count of the last bar. The line under the title lists the settings in use, so a screenshot always carries its own context.
🔶 DETAILS
🔸 A swing high or low is confirmed once it has the set number of bars on each side. A close beyond a confirmed swing is a structure break, and the last opposite candle before that break becomes the order block, using that candle's full high-to-low range.
🔸 A bull block breaks when a bar closes below its bottom, and a bear block breaks when a bar closes above its top. Wicks through a block do not break it.
🔸 Each block's age is counted in closed bars from the structure break that created it, not from the order block candle, so the drawn zone starts a few bars before age zero. Blocks that are still alive are included in the curves as "held at least this long", which is what the Kaplan–Meier method is designed for. Leaving them out would make blocks look shorter-lived than they are.
🔸 The drawn curves are a smoothed form of the raw hold rate. The smoothing narrows near age zero, where blocks break fastest, so the percentages, medians and odds stay close to the raw figures.
🔸 The lead is measured as the average number of bars each side holds within the curve horizon, and the panel shows it as a multiple: ×1.16 means the leading side's blocks hold 1.16 times as long. The test behind the p value groups blocks that lived through the same stretch of price together, since they are not independent of one another. Below a p value of 0.05 the gap is read as unlikely to be chance, and the Lead row and title bar take the leading side's colour.
🔸 The lead is not tested or shaded until each side has at least five breaks inside the horizon. A median shown as greater than the horizon means that side's curve has not fallen to 50% within it.
🔸 The optional confidence band is a 95% band around the leading side's curve, widened for the same grouping.
🔸 Text colours adjust to light and dark chart backgrounds, and fall back to the chart's own text colour where the bull and bear colours would be hard to read.
🔶 SETTINGS
🔸 Order blocks: swing length, how far back to search for the order block candle, and how many zones to show per side.
🔸 Hold curves: curve horizon, curve width, space before the curve, curve smoothing, the confidence band, and linking zones to the curve.
🔸 Panel: on or off, position, text size, and the hold window used for the "Holds next" rows.
🔶 NOTES
🔸 This is a context tool. The percentages, medians and odds are counts of what past order blocks on this chart did. They are not predictions, and nothing here tells you to buy or sell. A Lead row showing one side ahead is a statement about how long levels have lasted, not a trade direction. Use it alongside your own analysis and risk management.
🔸 Blocks form and break only on bar close. A zone appears on the close of the bar that breaks structure, with its start placed back on the order block candle, so it is always drawn at least one bar after that candle and at least Swing length + 1 bars after the swing it broke. Once a bar has closed, every block's range, age, percentage, both curves, both medians and the p value are fixed.
🔸 A few things move while a bar is still open, because they read the live price: which block the panel calls nearest, its distance, and whether price is above, below or inside it. If price pokes through a zone mid-bar, the zone stays until the close decides.
🔸 The curve chart is drawn to the right of the last bar and needs room there. Set your chart's right margin to roughly 115 bars at the default settings, a little more when old zones are parked past the curve, or reduce Curve width and Space before curve.
🔸 On most charts bull and bear blocks last about as long as each other, and the Lead row will say the gap could be chance. That is a normal result, not a fault. The nearest-level rows and the zone percentages are the part that changes as price moves.
🔸 The lead belongs to the curve horizon. The multiple and the p value are measured only up to that age, so a different horizon can give a different read on the same chart. Results also differ between timeframes on the same symbol.
🔸 Everything is measured from the bars loaded on your chart. More history gives the curves more blocks to work with, and a chart with little history will show wider swings in the figures.
🔸 Hold window is counted in bars, so on daily and weekly charts the default covers a long stretch of time. Lower it there if you want a nearer read.
🔸 Not every break of a swing makes a zone. A swing must be confirmed before it can be broken, and each swing is used once.
🔸 Up to 60 live blocks are tracked per side. The oldest beyond that stop being tracked and count as having held to that age.
🔸 On short histories the Lead row reads "collecting" until each side has enough breaks inside the horizon, and the lead is not shaded until then.
🔸 Scrolling or zooming redraws the layout, such as where the circles sit and where an old zone starts on the left. It does not change any price, age, percentage or panel number.
🔸 Built for standard candle charts.
🔶 SUMMARY
Order Block Holding Power measures how long order blocks last on your chart. The nearest live blocks are drawn on price with the share of past blocks that held as long as they have, two hold curves show the chance a bull or bear block is still holding at every age, and the panel gives the odds the nearest levels hold from here and which side's blocks are lasting longer.

면책사항
해당 정보와 게시물은 금융, 투자, 트레이딩 또는 기타 유형의 조언이나 권장 사항으로 간주되지 않으며, 트레이딩뷰에서 제공하거나 보증하는 것이 아닙니다. 자세한 내용은 이용 약관을 참조하세요.
면책사항
해당 정보와 게시물은 금융, 투자, 트레이딩 또는 기타 유형의 조언이나 권장 사항으로 간주되지 않으며, 트레이딩뷰에서 제공하거나 보증하는 것이 아닙니다. 자세한 내용은 이용 약관을 참조하세요.