OPEN-SOURCE SCRIPT
Institutional Footprint Divergence Engine
🔹 Introduction
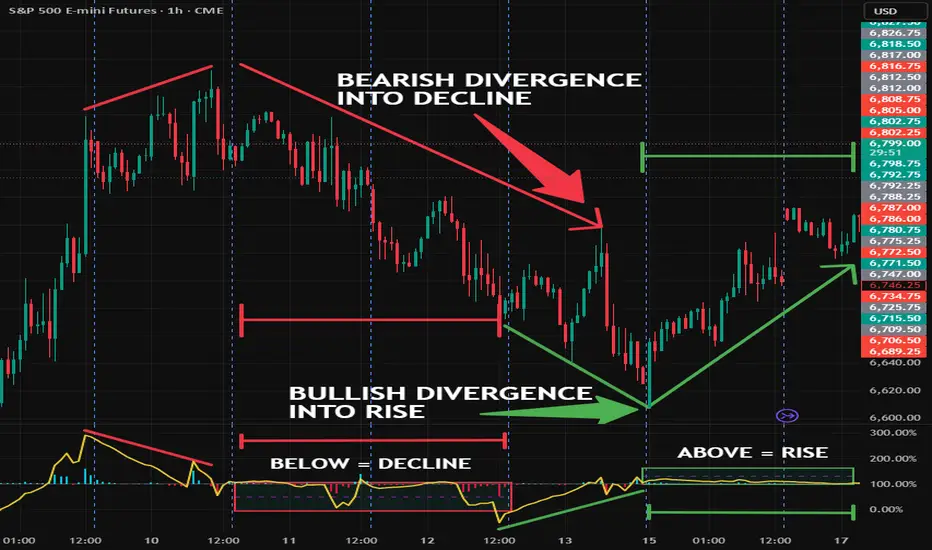
This indicator, the Institutional Footprint Divergence Engine, attempts to identify moments where price action and genuine order flow diverge — a condition that historically precedes reversals driven by smart money absorption and distribution. The core idea is this: if price makes a new swing high but the underlying buy-sell delta is contracting, the market is printing a higher high on less aggressive buying pressure, suggesting the move is being distributed into rather than genuinely accumulated. The inverse is equally meaningful at lows.
Unlike traditional divergence indicators that use derivative oscillators like RSI or MACD as the proxy for momentum, this script uses volume delta — the direct arithmetic difference between buying and selling volume at the bar level — sourced natively from TradingView's newly released request.footprint() function where a Premium or Ultimate subscription is active. On standard charts, the indicator falls back to a tick-estimated delta approximation. The distinction matters, and I'll cover precisely why throughout this description.
Every detected divergence is assigned a composite quality score from 0 to 100, computed across five weighted dimensions that assess the structural strength, volume context, cumulative delta alignment, and volatility regime at the moment of detection. Only divergences that clear a user-defined score threshold are displayed — filtering the noise that plagues most divergence tools.
🔹 The Premise — Why Delta Divergence Reveals Institutional Behavior
🔸 What volume delta actually measures
Every transaction in a liquid market has a buyer and a seller. Volume delta measures the net directional aggression of those transactions: it is the sum of volume that traded at the ask (aggressive buying) minus the volume that traded at the bid (aggressive selling) within a single bar. A positive delta bar means buyers were more aggressive. A negative delta bar means sellers were more aggressive.
This is categorically different from price direction. A bar can close higher while posting a negative delta — meaning price moved up, but sellers were the more aggressive counterparty throughout the move. This is the fingerprint of absorption: a large participant or group of participants quietly selling into rising price, absorbing aggressive buy orders without allowing the market to fall. They want retail to push price higher. They're using that momentum as liquidity to distribute their position.
Delta divergence is the systematic detection of this condition across swing structures.
🔸 The mechanics of absorption at swing highs
Assume price has been in an uptrend and just made a swing high at $4,200 with a delta of +850 contracts — strong buyer aggression confirming the high. Price retraces, then pushes up again to $4,215, printing a higher high. But this time, the delta is only +210. Price went higher. The aggressive buying volume did not.
What does this tell you? The move to $4,215 required proportionally far less buyer aggression than the move to $4,200. Two possibilities explain this: either sellers are absorbing the buying (distribution), or organic buying interest is fading and the move is increasingly resting on passive limit sell orders being consumed by declining buy-side momentum. Either way, the structural message is identical — the higher high is not supported by the order flow that created it, and the probability of continuation has deteriorated meaningfully.
This is the ICT and Smart Money Concepts concept of distribution rendered in order flow terms rather than price structure terms alone.
🔸 The symmetric argument at swing lows
At swing lows, the bullish divergence condition is: price makes a lower low, but the negative delta at that low is less negative than the prior swing low. Less aggressive selling at a lower price. This is absorption at the demand side — large buyers accumulating into weakness, absorbing retail sell orders without allowing price to collapse further. The lower low prints because they let it — they need the price to be there to fill their orders. But the delta tells you that sellers were unable to drive the same aggression they managed at the prior low.
Harris (2003), in his foundational text on market microstructure, describes this phenomenon as informed traders systematically positioning against the uninformed flow — using the uninformed participants' aggression as liquidity.
Cont, Stoikov & Talreja (2010), in their research on limit order book dynamics, demonstrate empirically that large passive participants consistently exploit periods of high aggressive flow imbalance to establish positions at favorable prices.
Delta divergence is not a leading indicator in the traditional sense. It is a coincident indicator of order flow context that becomes meaningful when paired with a confirmed swing structure.
🔸 Why native footprint data changes the calculus
Prior to January 2026, Pine Script had no access to true intrabar volume distribution. Every "delta" calculation in TradingView scripts was an estimate — typically assigning the bar's total volume directionally based on close position within the bar's range, or using up/down tick counting approximations. These methods are reasonable proxies but they introduce systematic errors: a bar that closes at its midpoint with heavy two-way activity looks identical to a quiet, directionless bar.
TradingView's request.footprint() function changes this entirely. It exposes the actual buy and sell volume recorded at each price level (row) within the bar — the genuine transaction-level data that footprint chart platforms like Sierra Chart and Bookmap have historically required separate subscriptions and data feeds to access. The delta returned by fp.delta() is not an estimate. It is the arithmetic difference between actual ask-side and bid-side transactions aggregated across the bar.
This is the first time this data has been natively programmable in Pine Script, and IFDE is built specifically around it.
🔹 How It Works
🔸 Footprint Data and the Delta Fallback
On a Premium or Ultimate TradingView account with a compatible symbol, request.footprint() returns a footprint object for each bar. IFDE calls fp.buy_volume() and fp.sell_volume() to get true directional volume, and fp.delta() for the bar's net delta. It also iterates every price row via fp.rows() and evaluates row.has_buy_imbalance() and row.has_sell_imbalance() — flagging bars where a disproportionate volume cluster exists at a specific price level, which often marks the precise price where institutional absorption occurred.
When footprint data is unavailable (standard account or non-supported symbol), the indicator falls back to a tick-estimated delta: up-close bars assign 100% of volume to the buy side; down-close bars assign 100% to the sell side; inside bars distribute proportionally based on close position within the range. This fallback is clearly flagged in the status label as ⚠️ ESTIMATED. The divergence logic functions identically in both modes — only the precision of the underlying delta changes.
The Ticks Per Footprint Row input controls the price granularity of the footprint: smaller values create more rows with finer resolution, larger values consolidate into fewer, broader rows. For index futures like ES and NQ, 4–10 ticks per row is typically appropriate. For crypto, you may need to experiment depending on the instrument's tick size.
🔸 Swing Pivot Detection
The indicator uses Pine's native ta.pivothigh() and ta.pivotlow() functions to identify confirmed swing highs and lows. The Swing Pivot Length input defines the lookback and lookahead symmetry of the pivot — a value of 10 means a bar must be the highest high within 10 bars on both sides to qualify as a pivot. Higher values find more significant structural swings but introduce more lag. Lower values are more responsive but noisier.
Critically, delta is sampled at the confirmed pivot bar using ta.valuewhen() — not at the current bar. This eliminates the most common repainting failure mode in divergence indicators: using the current bar's momentum reading to classify a past pivot. The delta value associated with each pivot is locked in the moment the pivot is confirmed.
🔸 Divergence Logic
Each time a new pivot high is confirmed, IFDE compares it against the previous confirmed pivot high. If the current price is higher but the current delta is lower, a bearish divergence is registered. The same comparison runs at pivot lows for bullish divergence, where current price lower and current delta less negative triggers the signal.
The Divergence Lookback setting controls the maximum bar distance between the two pivots being compared. Setting this too wide increases the chance of detecting structurally irrelevant comparisons — swings separated by 150 bars on a 5-minute chart may have no meaningful relationship. Setting it too tight misses legitimate multi-leg divergences. 40–60 bars is a reasonable starting point for most timeframes.
🔸 The ML Quality Score (0–100)
This is the engine's core differentiating feature. Every detected divergence is not displayed by default — it must first pass a composite quality score threshold. The score is calculated across five weighted dimensions:
Delta Magnitude is the most heavily weighted dimension by default (30%). It measures how extreme the opposing delta pressure is, normalised against the rolling maximum delta magnitude over the lookback window. A divergence where the delta is merely slightly less positive scores lower than one where the delta has completely reversed sign.
Volume Confirmation (25%) assesses whether total bar volume at the divergence pivot is above the 14-bar average. Low-volume divergences are structurally weaker — the absorption signal requires meaningful participation to be credible.
CVD Alignment (20%) checks whether the Cumulative Volume Delta — the running sum of all bar-level deltas, mean-reverted against its own moving average — is trending in the direction that supports the divergence. A bullish divergence at a price low carries far more weight when CVD has been quietly rising even as price made new lows.
Price Structure (15%) scores the magnitude of the price swing itself, relative to the current ATR. A divergence across a 0.5 ATR swing scores lower than one across a 2.5 ATR swing. Trivially small swings produce trivially meaningful divergence signals.
Regime Bonus (10%) applies a bonus or penalty based on the current volatility regime, described in detail below.
The weights are fully user-configurable in the 🤖 ML Score Weights input group. Shifting weight toward CVD Alignment, for example, will make the score more conservative and context-dependent. Shifting weight toward Delta Magnitude makes it more responsive to extreme single-bar order flow events. The scores are normalised internally so they always sum to 100 regardless of how you distribute the weights.
Only divergences scoring above the Min Quality Score threshold are displayed. The default of 55 is intentionally permissive to begin with. As you develop familiarity with the indicator on your instrument and timeframe, raising this to 65 or 70 will progressively filter toward only the highest-conviction setups.
🔸 Adaptive Regime Detection
The indicator compares the current 14-period ATR against its own simple moving average over the Regime Detection Period to classify the current volatility environment into three states: HIGH VOLATILITY, NORMAL, and LOW VOLATILITY.
In high volatility regimes, the score threshold is automatically scaled up by 20% — making it harder for a divergence to pass. This is because high-volatility environments produce frequent large delta swings that generate divergence signals with greater frequency but lower predictive value. The regime is tightening the filter precisely when noise is highest.
In low volatility regimes, the threshold is scaled down by 15%. Quiet, low-volatility markets are where institutional accumulation and distribution most commonly occurs under the radar — smaller delta contrasts carry more informational weight when total market activity is compressed.
The current regime and adjusted score floor are displayed in the status label in the top-left corner of the pane. A subtle background colour (green tint for low vol, red tint for high vol) is painted on the price chart to give continuous regime context at a glance.
🔸 The Pane Display
The indicator runs in its own pane below the price chart, containing three visual elements:
The delta histogram plots the smoothed EMA of bar-level delta as coloured columns — cyan for positive (net buying) and red for negative (net selling). The colour intensity scales with the magnitude of the delta relative to the recent maximum, so visually dominant bars correspond to the highest-conviction order flow readings.
The CVD deviation line in yellow shows the cumulative volume delta minus its moving average baseline. This is more useful than raw CVD for divergence context because it removes the secular trend in cumulative flow and focuses on relative shifts — making it easy to spot when CVD is rising or falling against price.
The zero line serves as the delta neutrality reference. Bars crossing from negative to positive delta, or vice versa, in the context of a divergence signal are particularly significant.
On the price chart, divergence lines connect the two pivot points being compared, with opacity scaling to score strength — higher-scoring divergences are rendered more vividly. Labels mark each divergence with its star rating (★ for score 55–69, ★★ for 70–84, ★★★ for 85–100) and the actual score value, along with whether live footprint data or tick estimation is in use.
🔹 Settings Reference
Swing Pivot Length — Controls pivot sensitivity. Lower = more signals, higher = more structural significance. Recommended: 8–15.
Divergence Lookback — Maximum bars between the two pivots being compared. Recommended: 30–75.
Min Quality Score — Score threshold below which divergences are hidden. Start at 55, tune upward as you calibrate to your instrument.
Ticks Per Footprint Row — Footprint granularity. Only relevant with live FP data. Tighter rows = more precision, more computation.
Delta Smoothing Period — EMA period applied to raw delta before divergence comparison. Smoothing reduces false triggers from single noisy bars. Recommended: 2–5.
CVD Baseline Length — Period of the SMA used to mean-revert the cumulative delta. Shorter = more responsive CVD; longer = smoother trend.
Alert Min Score — Score threshold for alert conditions. Set higher than the display threshold if you want alerts only for the strongest signals.
🔹 Closing Remarks
Delta divergence is one of the few conditions in technical analysis that has a genuinely defensible mechanical explanation rooted in market microstructure — it is not a pattern-matching heuristic but a direct observation of the imbalance between aggressive buying and selling pressure across a swing structure. The availability of native footprint data in Pine Script for the first time makes it possible to build this kind of tool without the estimations and approximations that have historically compromised order flow analysis within TradingView.
That said, this indicator is a probabilistic model, not a signal generator. A score of 90 does not mean the trade works. It means the order flow context at that divergence was unusually well-structured relative to the five dimensions measured. Markets can and do continue trending through well-formed divergences, particularly in strongly trending regimes where institutional participants are not distributing but rather re-accumulating on every pullback.
The most effective use of IFDE is as a confluence filter — a condition that must be present alongside your existing structural, session, or macro framework before you engage a level. A bearish divergence at a weekly resistance level, in a high-volatility regime, scoring 82, with live footprint data showing 7 sell imbalance clusters, is a meaningfully different proposition than a 56-scoring divergence on estimated delta at a randomly selected intraday high.
Use the score. Respect the regime. Verify the data source. The rest is your edge.
🔹 References
Market Microstructure & Order Flow
Harris, L. (2003). Trading and Exchanges: Market Microstructure for Practitioners. Oxford University Press.
Cont, R., Stoikov, S., & Talreja, R. (2010). A stochastic model for order book dynamics. Operations Research, 58(3), 549–563.
Volume and Delta Analysis
Easley, D., & O'Hara, M. (1992). Time and the process of security price adjustment. Journal of Finance, 47(2), 577–605.
Easley, D., Hvidkjaer, S., & O'Hara, M. (2002). Is information risk a determinant of asset returns? Journal of Finance, 57(5), 2185–2221.
Institutional Order Flow & Smart Money
Chordia, T., Roll, R., & Subrahmanyam, A. (2002). Order imbalance, liquidity, and market returns. Journal of Financial Economics, 65(1), 111–130.
Grinblatt, M., & Keloharju, M. (2000). The investment behavior and performance of various investor types. Journal of Financial Economics, 55(1), 43–67.
This indicator, the Institutional Footprint Divergence Engine, attempts to identify moments where price action and genuine order flow diverge — a condition that historically precedes reversals driven by smart money absorption and distribution. The core idea is this: if price makes a new swing high but the underlying buy-sell delta is contracting, the market is printing a higher high on less aggressive buying pressure, suggesting the move is being distributed into rather than genuinely accumulated. The inverse is equally meaningful at lows.
Unlike traditional divergence indicators that use derivative oscillators like RSI or MACD as the proxy for momentum, this script uses volume delta — the direct arithmetic difference between buying and selling volume at the bar level — sourced natively from TradingView's newly released request.footprint() function where a Premium or Ultimate subscription is active. On standard charts, the indicator falls back to a tick-estimated delta approximation. The distinction matters, and I'll cover precisely why throughout this description.
Every detected divergence is assigned a composite quality score from 0 to 100, computed across five weighted dimensions that assess the structural strength, volume context, cumulative delta alignment, and volatility regime at the moment of detection. Only divergences that clear a user-defined score threshold are displayed — filtering the noise that plagues most divergence tools.
🔹 The Premise — Why Delta Divergence Reveals Institutional Behavior
🔸 What volume delta actually measures
Every transaction in a liquid market has a buyer and a seller. Volume delta measures the net directional aggression of those transactions: it is the sum of volume that traded at the ask (aggressive buying) minus the volume that traded at the bid (aggressive selling) within a single bar. A positive delta bar means buyers were more aggressive. A negative delta bar means sellers were more aggressive.
This is categorically different from price direction. A bar can close higher while posting a negative delta — meaning price moved up, but sellers were the more aggressive counterparty throughout the move. This is the fingerprint of absorption: a large participant or group of participants quietly selling into rising price, absorbing aggressive buy orders without allowing the market to fall. They want retail to push price higher. They're using that momentum as liquidity to distribute their position.
Delta divergence is the systematic detection of this condition across swing structures.
🔸 The mechanics of absorption at swing highs
Assume price has been in an uptrend and just made a swing high at $4,200 with a delta of +850 contracts — strong buyer aggression confirming the high. Price retraces, then pushes up again to $4,215, printing a higher high. But this time, the delta is only +210. Price went higher. The aggressive buying volume did not.
What does this tell you? The move to $4,215 required proportionally far less buyer aggression than the move to $4,200. Two possibilities explain this: either sellers are absorbing the buying (distribution), or organic buying interest is fading and the move is increasingly resting on passive limit sell orders being consumed by declining buy-side momentum. Either way, the structural message is identical — the higher high is not supported by the order flow that created it, and the probability of continuation has deteriorated meaningfully.
This is the ICT and Smart Money Concepts concept of distribution rendered in order flow terms rather than price structure terms alone.
🔸 The symmetric argument at swing lows
At swing lows, the bullish divergence condition is: price makes a lower low, but the negative delta at that low is less negative than the prior swing low. Less aggressive selling at a lower price. This is absorption at the demand side — large buyers accumulating into weakness, absorbing retail sell orders without allowing price to collapse further. The lower low prints because they let it — they need the price to be there to fill their orders. But the delta tells you that sellers were unable to drive the same aggression they managed at the prior low.
Harris (2003), in his foundational text on market microstructure, describes this phenomenon as informed traders systematically positioning against the uninformed flow — using the uninformed participants' aggression as liquidity.
Cont, Stoikov & Talreja (2010), in their research on limit order book dynamics, demonstrate empirically that large passive participants consistently exploit periods of high aggressive flow imbalance to establish positions at favorable prices.
Delta divergence is not a leading indicator in the traditional sense. It is a coincident indicator of order flow context that becomes meaningful when paired with a confirmed swing structure.
🔸 Why native footprint data changes the calculus
Prior to January 2026, Pine Script had no access to true intrabar volume distribution. Every "delta" calculation in TradingView scripts was an estimate — typically assigning the bar's total volume directionally based on close position within the bar's range, or using up/down tick counting approximations. These methods are reasonable proxies but they introduce systematic errors: a bar that closes at its midpoint with heavy two-way activity looks identical to a quiet, directionless bar.
TradingView's request.footprint() function changes this entirely. It exposes the actual buy and sell volume recorded at each price level (row) within the bar — the genuine transaction-level data that footprint chart platforms like Sierra Chart and Bookmap have historically required separate subscriptions and data feeds to access. The delta returned by fp.delta() is not an estimate. It is the arithmetic difference between actual ask-side and bid-side transactions aggregated across the bar.
This is the first time this data has been natively programmable in Pine Script, and IFDE is built specifically around it.
🔹 How It Works
🔸 Footprint Data and the Delta Fallback
On a Premium or Ultimate TradingView account with a compatible symbol, request.footprint() returns a footprint object for each bar. IFDE calls fp.buy_volume() and fp.sell_volume() to get true directional volume, and fp.delta() for the bar's net delta. It also iterates every price row via fp.rows() and evaluates row.has_buy_imbalance() and row.has_sell_imbalance() — flagging bars where a disproportionate volume cluster exists at a specific price level, which often marks the precise price where institutional absorption occurred.
When footprint data is unavailable (standard account or non-supported symbol), the indicator falls back to a tick-estimated delta: up-close bars assign 100% of volume to the buy side; down-close bars assign 100% to the sell side; inside bars distribute proportionally based on close position within the range. This fallback is clearly flagged in the status label as ⚠️ ESTIMATED. The divergence logic functions identically in both modes — only the precision of the underlying delta changes.
The Ticks Per Footprint Row input controls the price granularity of the footprint: smaller values create more rows with finer resolution, larger values consolidate into fewer, broader rows. For index futures like ES and NQ, 4–10 ticks per row is typically appropriate. For crypto, you may need to experiment depending on the instrument's tick size.
🔸 Swing Pivot Detection
The indicator uses Pine's native ta.pivothigh() and ta.pivotlow() functions to identify confirmed swing highs and lows. The Swing Pivot Length input defines the lookback and lookahead symmetry of the pivot — a value of 10 means a bar must be the highest high within 10 bars on both sides to qualify as a pivot. Higher values find more significant structural swings but introduce more lag. Lower values are more responsive but noisier.
Critically, delta is sampled at the confirmed pivot bar using ta.valuewhen() — not at the current bar. This eliminates the most common repainting failure mode in divergence indicators: using the current bar's momentum reading to classify a past pivot. The delta value associated with each pivot is locked in the moment the pivot is confirmed.
🔸 Divergence Logic
Each time a new pivot high is confirmed, IFDE compares it against the previous confirmed pivot high. If the current price is higher but the current delta is lower, a bearish divergence is registered. The same comparison runs at pivot lows for bullish divergence, where current price lower and current delta less negative triggers the signal.
The Divergence Lookback setting controls the maximum bar distance between the two pivots being compared. Setting this too wide increases the chance of detecting structurally irrelevant comparisons — swings separated by 150 bars on a 5-minute chart may have no meaningful relationship. Setting it too tight misses legitimate multi-leg divergences. 40–60 bars is a reasonable starting point for most timeframes.
🔸 The ML Quality Score (0–100)
This is the engine's core differentiating feature. Every detected divergence is not displayed by default — it must first pass a composite quality score threshold. The score is calculated across five weighted dimensions:
Delta Magnitude is the most heavily weighted dimension by default (30%). It measures how extreme the opposing delta pressure is, normalised against the rolling maximum delta magnitude over the lookback window. A divergence where the delta is merely slightly less positive scores lower than one where the delta has completely reversed sign.
Volume Confirmation (25%) assesses whether total bar volume at the divergence pivot is above the 14-bar average. Low-volume divergences are structurally weaker — the absorption signal requires meaningful participation to be credible.
CVD Alignment (20%) checks whether the Cumulative Volume Delta — the running sum of all bar-level deltas, mean-reverted against its own moving average — is trending in the direction that supports the divergence. A bullish divergence at a price low carries far more weight when CVD has been quietly rising even as price made new lows.
Price Structure (15%) scores the magnitude of the price swing itself, relative to the current ATR. A divergence across a 0.5 ATR swing scores lower than one across a 2.5 ATR swing. Trivially small swings produce trivially meaningful divergence signals.
Regime Bonus (10%) applies a bonus or penalty based on the current volatility regime, described in detail below.
The weights are fully user-configurable in the 🤖 ML Score Weights input group. Shifting weight toward CVD Alignment, for example, will make the score more conservative and context-dependent. Shifting weight toward Delta Magnitude makes it more responsive to extreme single-bar order flow events. The scores are normalised internally so they always sum to 100 regardless of how you distribute the weights.
Only divergences scoring above the Min Quality Score threshold are displayed. The default of 55 is intentionally permissive to begin with. As you develop familiarity with the indicator on your instrument and timeframe, raising this to 65 or 70 will progressively filter toward only the highest-conviction setups.
🔸 Adaptive Regime Detection
The indicator compares the current 14-period ATR against its own simple moving average over the Regime Detection Period to classify the current volatility environment into three states: HIGH VOLATILITY, NORMAL, and LOW VOLATILITY.
In high volatility regimes, the score threshold is automatically scaled up by 20% — making it harder for a divergence to pass. This is because high-volatility environments produce frequent large delta swings that generate divergence signals with greater frequency but lower predictive value. The regime is tightening the filter precisely when noise is highest.
In low volatility regimes, the threshold is scaled down by 15%. Quiet, low-volatility markets are where institutional accumulation and distribution most commonly occurs under the radar — smaller delta contrasts carry more informational weight when total market activity is compressed.
The current regime and adjusted score floor are displayed in the status label in the top-left corner of the pane. A subtle background colour (green tint for low vol, red tint for high vol) is painted on the price chart to give continuous regime context at a glance.
🔸 The Pane Display
The indicator runs in its own pane below the price chart, containing three visual elements:
The delta histogram plots the smoothed EMA of bar-level delta as coloured columns — cyan for positive (net buying) and red for negative (net selling). The colour intensity scales with the magnitude of the delta relative to the recent maximum, so visually dominant bars correspond to the highest-conviction order flow readings.
The CVD deviation line in yellow shows the cumulative volume delta minus its moving average baseline. This is more useful than raw CVD for divergence context because it removes the secular trend in cumulative flow and focuses on relative shifts — making it easy to spot when CVD is rising or falling against price.
The zero line serves as the delta neutrality reference. Bars crossing from negative to positive delta, or vice versa, in the context of a divergence signal are particularly significant.
On the price chart, divergence lines connect the two pivot points being compared, with opacity scaling to score strength — higher-scoring divergences are rendered more vividly. Labels mark each divergence with its star rating (★ for score 55–69, ★★ for 70–84, ★★★ for 85–100) and the actual score value, along with whether live footprint data or tick estimation is in use.
🔹 Settings Reference
Swing Pivot Length — Controls pivot sensitivity. Lower = more signals, higher = more structural significance. Recommended: 8–15.
Divergence Lookback — Maximum bars between the two pivots being compared. Recommended: 30–75.
Min Quality Score — Score threshold below which divergences are hidden. Start at 55, tune upward as you calibrate to your instrument.
Ticks Per Footprint Row — Footprint granularity. Only relevant with live FP data. Tighter rows = more precision, more computation.
Delta Smoothing Period — EMA period applied to raw delta before divergence comparison. Smoothing reduces false triggers from single noisy bars. Recommended: 2–5.
CVD Baseline Length — Period of the SMA used to mean-revert the cumulative delta. Shorter = more responsive CVD; longer = smoother trend.
Alert Min Score — Score threshold for alert conditions. Set higher than the display threshold if you want alerts only for the strongest signals.
🔹 Closing Remarks
Delta divergence is one of the few conditions in technical analysis that has a genuinely defensible mechanical explanation rooted in market microstructure — it is not a pattern-matching heuristic but a direct observation of the imbalance between aggressive buying and selling pressure across a swing structure. The availability of native footprint data in Pine Script for the first time makes it possible to build this kind of tool without the estimations and approximations that have historically compromised order flow analysis within TradingView.
That said, this indicator is a probabilistic model, not a signal generator. A score of 90 does not mean the trade works. It means the order flow context at that divergence was unusually well-structured relative to the five dimensions measured. Markets can and do continue trending through well-formed divergences, particularly in strongly trending regimes where institutional participants are not distributing but rather re-accumulating on every pullback.
The most effective use of IFDE is as a confluence filter — a condition that must be present alongside your existing structural, session, or macro framework before you engage a level. A bearish divergence at a weekly resistance level, in a high-volatility regime, scoring 82, with live footprint data showing 7 sell imbalance clusters, is a meaningfully different proposition than a 56-scoring divergence on estimated delta at a randomly selected intraday high.
Use the score. Respect the regime. Verify the data source. The rest is your edge.
🔹 References
Market Microstructure & Order Flow
Harris, L. (2003). Trading and Exchanges: Market Microstructure for Practitioners. Oxford University Press.
Cont, R., Stoikov, S., & Talreja, R. (2010). A stochastic model for order book dynamics. Operations Research, 58(3), 549–563.
Volume and Delta Analysis
Easley, D., & O'Hara, M. (1992). Time and the process of security price adjustment. Journal of Finance, 47(2), 577–605.
Easley, D., Hvidkjaer, S., & O'Hara, M. (2002). Is information risk a determinant of asset returns? Journal of Finance, 57(5), 2185–2221.
Institutional Order Flow & Smart Money
Chordia, T., Roll, R., & Subrahmanyam, A. (2002). Order imbalance, liquidity, and market returns. Journal of Financial Economics, 65(1), 111–130.
Grinblatt, M., & Keloharju, M. (2000). The investment behavior and performance of various investor types. Journal of Financial Economics, 55(1), 43–67.
오픈 소스 스크립트
트레이딩뷰의 진정한 정신에 따라, 이 스크립트의 작성자는 이를 오픈소스로 공개하여 트레이더들이 기능을 검토하고 검증할 수 있도록 했습니다. 작성자에게 찬사를 보냅니다! 이 코드는 무료로 사용할 수 있지만, 코드를 재게시하는 경우 하우스 룰이 적용된다는 점을 기억하세요.

Thanks for the support!
면책사항
해당 정보와 게시물은 금융, 투자, 트레이딩 또는 기타 유형의 조언이나 권장 사항으로 간주되지 않으며, 트레이딩뷰에서 제공하거나 보증하는 것이 아닙니다. 자세한 내용은 이용 약관을 참조하세요.
오픈 소스 스크립트
트레이딩뷰의 진정한 정신에 따라, 이 스크립트의 작성자는 이를 오픈소스로 공개하여 트레이더들이 기능을 검토하고 검증할 수 있도록 했습니다. 작성자에게 찬사를 보냅니다! 이 코드는 무료로 사용할 수 있지만, 코드를 재게시하는 경우 하우스 룰이 적용된다는 점을 기억하세요.
Thanks for the support!
면책사항
해당 정보와 게시물은 금융, 투자, 트레이딩 또는 기타 유형의 조언이나 권장 사항으로 간주되지 않으며, 트레이딩뷰에서 제공하거나 보증하는 것이 아닙니다. 자세한 내용은 이용 약관을 참조하세요.