OPEN-SOURCE SCRIPT
업데이트됨 ATR Stop - w/TP & Stats
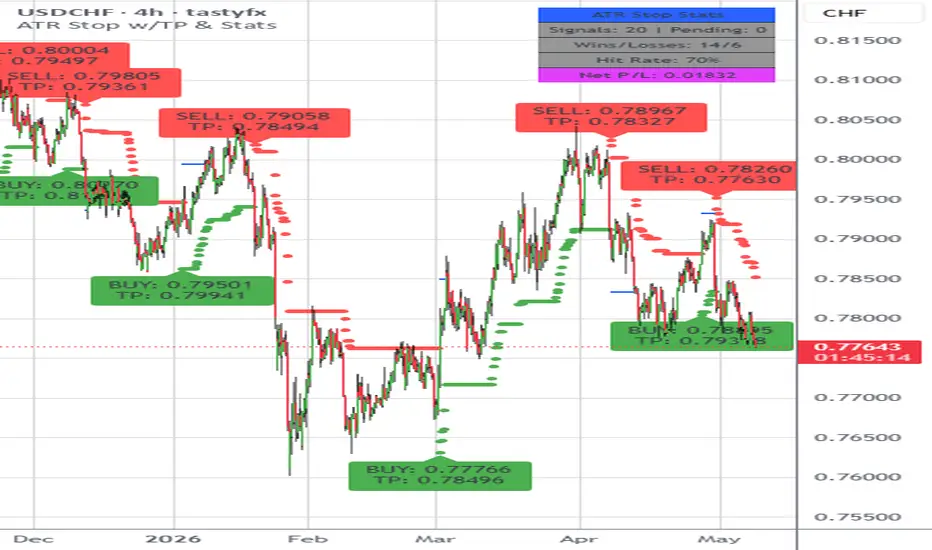
ATR Stop – With Take Profit & Performance Stats
This indicator builds on the classic ATR trailing stop concept by adding automated take-profit targets, signal tracking, and real-time performance statistics directly on the chart.
It is designed to help traders visualize trend reversals, trade targets, and historical signal performance without needing a separate strategy backtest.
Indicator Overview
The script calculates a dynamic trailing stop using Average True Range (ATR).
When price crosses the stop level, a BUY or SELL signal is generated.
Each signal automatically receives a take-profit level based on ATR, and the indicator tracks whether the trade:
Hits the TP → Win
Gets replaced by a new signal before TP → Loss
Is still active → Pending
A statistics panel summarizes the results of recent signals.
Core Features
ATR Trailing Stop System
Uses ATR to dynamically calculate a trailing stop.
Stop flips direction when price crosses it.
Provides clear visual trend direction.
Automatic Buy / Sell Signals
BUY when price crosses above the ATR stop.
SELL when price crosses below the ATR stop.
Optional non-repainting confirmation on candle close.
ATR-Based Take Profit Targets
Each signal creates a take-profit level based on ATR multiple.
TP lines extend while the trade is active.
When TP is hit, the trade is marked as a win.
Signal Outcome Tracking
Trades are categorized as:
Win → TP reached
Loss → Opposite signal appears before TP
Pending → TP not yet reached
This allows quick evaluation of signal quality.
Performance Statistics Panel
Displays real-time statistics including:
Total signals
Pending trades
Wins and losses
Hit rate %
Statistics are calculated from the most recent signals defined by the lookback setting.
Chart Visualization
ATR stop plotted on chart
BUY / SELL labels with TP price
Optional TP lines
Optional bar coloring based on trend direction
Key Inputs
ATR Period
Length used for ATR calculation.
ATR Multiplier
Distance of the trailing stop from price.
Take Profit ATR Multiplier
Distance of TP level relative to ATR.
Lookback Closed Trades
Number of completed trades included in statistics.
Non-Repainting Signals
Signals only trigger on confirmed candle closes.
Show Take Profit Lines
Toggle visibility of TP lines.
Bar Coloring
Color candles based on ATR stop direction.
How Trade Outcomes Are Determined
Signal appears
TP level is calculated using ATR
Trade remains pending
One of two events resolves the trade:
TP Hit
Trade counted as Win
Opposite Signal Before TP
Previous trade counted as Loss
What Makes This Indicator Useful
Combines trend detection + trade management
Provides visual TP targets
Tracks signal performance automatically
Maintains clean charts using rolling lookback statistics
Designed for manual trading analysis and signal validation
Alerts
Two alert conditions are included:
Buy Signal
Sell Signal
These can be used to trigger TradingView alerts or automation workflows.
Typical Use Cases
Trend following strategies
ATR-based trade management
Signal quality evaluation
Visual backtesting
Entry/exit reference levels
This indicator builds on the classic ATR trailing stop concept by adding automated take-profit targets, signal tracking, and real-time performance statistics directly on the chart.
It is designed to help traders visualize trend reversals, trade targets, and historical signal performance without needing a separate strategy backtest.
Indicator Overview
The script calculates a dynamic trailing stop using Average True Range (ATR).
When price crosses the stop level, a BUY or SELL signal is generated.
Each signal automatically receives a take-profit level based on ATR, and the indicator tracks whether the trade:
Hits the TP → Win
Gets replaced by a new signal before TP → Loss
Is still active → Pending
A statistics panel summarizes the results of recent signals.
Core Features
ATR Trailing Stop System
Uses ATR to dynamically calculate a trailing stop.
Stop flips direction when price crosses it.
Provides clear visual trend direction.
Automatic Buy / Sell Signals
BUY when price crosses above the ATR stop.
SELL when price crosses below the ATR stop.
Optional non-repainting confirmation on candle close.
ATR-Based Take Profit Targets
Each signal creates a take-profit level based on ATR multiple.
TP lines extend while the trade is active.
When TP is hit, the trade is marked as a win.
Signal Outcome Tracking
Trades are categorized as:
Win → TP reached
Loss → Opposite signal appears before TP
Pending → TP not yet reached
This allows quick evaluation of signal quality.
Performance Statistics Panel
Displays real-time statistics including:
Total signals
Pending trades
Wins and losses
Hit rate %
Statistics are calculated from the most recent signals defined by the lookback setting.
Chart Visualization
ATR stop plotted on chart
BUY / SELL labels with TP price
Optional TP lines
Optional bar coloring based on trend direction
Key Inputs
ATR Period
Length used for ATR calculation.
ATR Multiplier
Distance of the trailing stop from price.
Take Profit ATR Multiplier
Distance of TP level relative to ATR.
Lookback Closed Trades
Number of completed trades included in statistics.
Non-Repainting Signals
Signals only trigger on confirmed candle closes.
Show Take Profit Lines
Toggle visibility of TP lines.
Bar Coloring
Color candles based on ATR stop direction.
How Trade Outcomes Are Determined
Signal appears
TP level is calculated using ATR
Trade remains pending
One of two events resolves the trade:
TP Hit
Trade counted as Win
Opposite Signal Before TP
Previous trade counted as Loss
What Makes This Indicator Useful
Combines trend detection + trade management
Provides visual TP targets
Tracks signal performance automatically
Maintains clean charts using rolling lookback statistics
Designed for manual trading analysis and signal validation
Alerts
Two alert conditions are included:
Buy Signal
Sell Signal
These can be used to trigger TradingView alerts or automation workflows.
Typical Use Cases
Trend following strategies
ATR-based trade management
Signal quality evaluation
Visual backtesting
Entry/exit reference levels
릴리즈 노트
Updated by adding a checkbox for TP visuals on inputs tab.릴리즈 노트
Updated Stats added Net P/L.릴리즈 노트
Added user functionality.Updated label display.
Updated stats window with user controls.
릴리즈 노트
Pine category updated.오픈 소스 스크립트
트레이딩뷰의 진정한 정신에 따라, 이 스크립트의 작성자는 이를 오픈소스로 공개하여 트레이더들이 기능을 검토하고 검증할 수 있도록 했습니다. 작성자에게 찬사를 보냅니다! 이 코드는 무료로 사용할 수 있지만, 코드를 재게시하는 경우 하우스 룰이 적용된다는 점을 기억하세요.

면책사항
해당 정보와 게시물은 금융, 투자, 트레이딩 또는 기타 유형의 조언이나 권장 사항으로 간주되지 않으며, 트레이딩뷰에서 제공하거나 보증하는 것이 아닙니다. 자세한 내용은 이용 약관을 참조하세요.
오픈 소스 스크립트
트레이딩뷰의 진정한 정신에 따라, 이 스크립트의 작성자는 이를 오픈소스로 공개하여 트레이더들이 기능을 검토하고 검증할 수 있도록 했습니다. 작성자에게 찬사를 보냅니다! 이 코드는 무료로 사용할 수 있지만, 코드를 재게시하는 경우 하우스 룰이 적용된다는 점을 기억하세요.
면책사항
해당 정보와 게시물은 금융, 투자, 트레이딩 또는 기타 유형의 조언이나 권장 사항으로 간주되지 않으며, 트레이딩뷰에서 제공하거나 보증하는 것이 아닙니다. 자세한 내용은 이용 약관을 참조하세요.